Title: Viewing curve speed limits and calculating acceleration time/distance
Post by: dannyliux on January 01, 2020, 10:27:56 PM
Post by: dannyliux on January 01, 2020, 10:27:56 PM
Recently I've been playing Transport Fever, and while it's a more casual type of transport sim it does have some useful features. The first is the ability to see track curve speed limits:

And secondly the ability to see how long, in terms of distance and time, a consist will take to accelerate to max speed on flat ground.

As far as I am aware, these features don't seem to be present in Simutrans Extended? I think it'll be really useful to know the track speed limit without having to run a train through it. And perhaps the acceleration distance could be posted beside the braking distance? Right now it's mostly down to guesswork because locomotive power ratings seem to be peak power, and thus my calculations almost always underestimate the acceleration distance.
And secondly the ability to see how long, in terms of distance and time, a consist will take to accelerate to max speed on flat ground.
As far as I am aware, these features don't seem to be present in Simutrans Extended? I think it'll be really useful to know the track speed limit without having to run a train through it. And perhaps the acceleration distance could be posted beside the braking distance? Right now it's mostly down to guesswork because locomotive power ratings seem to be peak power, and thus my calculations almost always underestimate the acceleration distance.
Title: Re: Viewing curve speed limits and calculating acceleration time/distance
Post by: jamespetts on January 02, 2020, 12:34:11 AM
Post by: jamespetts on January 02, 2020, 12:34:11 AM
I can see that this might be useful - but this would be very complex to implement in Extended, not least because the curvature is extrapolated from neighbouring tiles to make up for the very limited granularity in directions (on a tile by tile level, one can only have 45 degree or 90 degree corners, and even the 45 degree corners are a hack combining two 90 degree corners in opposite directions). This means that the same tile of track can have a different speed limit depending on what goes before and after it, which is especially an issue at junctions.
Incidentally, I will move this to the Simutrans-Extended development forum, as this is a feature request.
Incidentally, I will move this to the Simutrans-Extended development forum, as this is a feature request.
Title: Re: Viewing curve speed limits and calculating acceleration time/distance
Post by: Ranran(retired) on January 02, 2020, 10:49:55 AM
Post by: Ranran(retired) on January 02, 2020, 10:49:55 AM
Quote from: dannyliux on January 01, 2020, 10:27:56 PMthe ability to see how long, in terms of distance and time, a consist will take to accelerate to max speed on flat ground.I think this thread is related to the acceleration time estimation. (https://forum.simutrans.com/index.php/topic,19363.0.html)
In Transport fever 2, the evaluation of convoy's acceleration power (power balance) is roughly evaluated as very good / good / bad, and the player determines the number of connected coaches or wagons with reference to it.
Currently in Simutrans-Extended, it is possible to estimate it from tractive force and convoy weight, but few people will be able to calculate and judge it instantly. Therefore, the acceleration notation is a good guide for players, as requested in the thread above.
This is a Japanese instant noodle patch. The display of acceleration is added next to the braking distance. check it out :arrow:

As I mentioned before, this should be able to switch the display unit like date and time display according to each country, but please note that since this is only a display test, it is a common km/h/s display in Japan. Also does not consider max loading weight yet.
Title: Re: Viewing curve speed limits and calculating acceleration time/distance
Post by: jamespetts on January 02, 2020, 11:08:21 AM
Post by: jamespetts on January 02, 2020, 11:08:21 AM
This is an interesting patch; thank you. I should note that doing this in km/h/s is almost certainly far clearer to a player than doing it in m/s2, as the former measure is related to something that the player can readily understand (km/h), whereas m/s is not a normal way of thinking about the speed of transport vehicles.
I wonder whether this display might also be added to the convoy detail display?
I wonder whether this display might also be added to the convoy detail display?
Title: Re: Viewing curve speed limits and calculating acceleration time/distance
Post by: Vladki on January 02, 2020, 11:15:26 AM
Post by: Vladki on January 02, 2020, 11:15:26 AM
The acceleration of (fast) passenger cars is often specified as the time needed to accelerate from 0 to 100 km/h. Although the acceleration is not constant, it can be estimated from km/h/s (x100).
Many vehicles in simutrans will not be able to run that fast, but it could be modified to time needed to gain full/max speed, or some portion of it.
Other countries may use something else for acceleration, just as with fuel consumption. Here we use liters per 100 km (less is better), americans use miles per gallon (more is better).
Title: Re: Viewing curve speed limits and calculating acceleration time/distance
Post by: Ranran(retired) on January 02, 2020, 11:17:01 AM
Post by: Ranran(retired) on January 02, 2020, 11:17:01 AM
I overlooked a big issue - gear. (´・ω・`)
Simutrans's "gear" simply multiplies power. So the difference in gear makes a difference in the apparent acceleration.
Perhaps setting the nominal value will show data close to the nominal acceleration, but the actual in-game acceleration may be different because gear is not taken into account.
However, I have no idea about that solution...
For example, should gear be multiplied by the value of gear based on 0.8?
Quote from: jamespetts on January 02, 2020, 11:08:21 AMI wonder whether this display might also be added to the convoy detail display?Yes, it could be added the same display there.
Title: Re: Viewing curve speed limits and calculating acceleration time/distance
Post by: Mariculous on January 02, 2020, 11:38:14 AM
Post by: Mariculous on January 02, 2020, 11:38:14 AM
Yep, gear i simutrans it really that simple.
effective_power=power*gear
It has nothing to do with actual gearing, it should better be named something like power_loss_factor.
I am wondering how exactly you calculate acceleration. Force decreases with growing speed, thus acceleration als decreases.
Did you calculate starting acceleration, average 0-100 acceleration, average overall acceleration?
Title: Re: Viewing curve speed limits and calculating acceleration time/distance
Post by: jamespetts on January 02, 2020, 12:39:37 PM
Post by: jamespetts on January 02, 2020, 12:39:37 PM
"Gear" is a very poor name for this, and very confusing. In the Simutrans-Extended English translation texts, it has been renamed to "power output ratio". It is used simply to simulate transmission losses so that a vehicle's nominal power output based on actual research can be used even when that nominal power output does not take into account transmission losses.
Title: Re: Viewing curve speed limits and calculating acceleration time/distance
Post by: dannyliux on January 02, 2020, 01:44:12 PM
Post by: dannyliux on January 02, 2020, 01:44:12 PM
Personally, I think a 'time/distance to accelerate to top speed/100kph' would be better, firstly because of the variable acceleration. Secondly, I think that information is more useful since players use the distance between stops or journey time when planning consists, it makes more sense to include distance/time info.
As for the curve speed, is there any formula or look-up tables for players to calculate it manually? I would still like to be able to plan my route better, but I understand that the overlay approach may not be feasible.
As for the curve speed, is there any formula or look-up tables for players to calculate it manually? I would still like to be able to plan my route better, but I understand that the overlay approach may not be feasible.
Title: Re: Viewing curve speed limits and calculating acceleration time/distance
Post by: jamespetts on January 02, 2020, 01:57:15 PM
Post by: jamespetts on January 02, 2020, 01:57:15 PM
Quote from: dannyliux on January 02, 2020, 01:44:12 PM
Personally, I think a 'time/distance to accelerate to top speed/100kph' would be better, firstly because of the variable acceleration. Secondly, I think that information is more useful since players use the distance between stops or journey time when planning consists, it makes more sense to include distance/time info.
I can see the merit in that approach, as it might be easier for players to interpret than a km/h/s figure, especially given the non-linearity of acceleration. Distance to reach top speed is probably the most useful figure for players in this context.
QuoteAs for the curve speed, is there any formula or look-up tables for players to calculate it manually? I would still like to be able to plan my route better, but I understand that the overlay approach may not be feasible.
There is a formula, based on real railway cornering speeds, but I must confess that I cannot remember what it is now. It should be in the code somewhere; I think that there is a link to the website that described the formula either in the code, on this forum, or both.
Title: Re: Viewing curve speed limits and calculating acceleration time/distance
Post by: Ves on January 02, 2020, 02:18:53 PM
Post by: Ves on January 02, 2020, 02:18:53 PM
I would like there to be both the "0-100km/h in X seconds", as well as "top speed reached in X meters". The first is useful to compare vehicles against each other. The later is useful especially for trains as that might help you with the track and signal layout.
As for curve speed, I think we talked about it a while ago.
Don't you think it would be possible for the infowindow of a piece of track to count the tiles in either direction and from that determine it's gradient at its tile? Will be hard at junctions, but that should perhaps just kill the search, or perhaps do some clever tile counting to determine the straightest path through the junction and display that.
Title: Re: Viewing curve speed limits and calculating acceleration time/distance
Post by: jamespetts on January 02, 2020, 02:24:30 PM
Post by: jamespetts on January 02, 2020, 02:24:30 PM
Quote from: Ves on January 02, 2020, 02:18:53 PM
I would like there to be both the "0-100km/h in X seconds", as well as "top speed reached in X meters". The first is useful to compare vehicles against each other. The later is useful especially for trains as that might help you with the track and signal layout.
The trouble with using a fixed speed is that there are a lot of vehicles that have a low top speed, less than 100km/h.
QuoteAs for curve speed, I think we talked about it a while ago.
Don't you think it would be possible for the infowindow of a piece of track to count the tiles in either direction and from that determine it's gradient at its tile? Will be hard at junctions, but that should perhaps just kill the search, or perhaps do some clever tile counting to determine the straightest path through the junction and display that.
I am sure that it is possible in theory to do this, but the workload of this would be very high and its priority low compared to many, many years' worth of other features.
Title: Re: Viewing curve speed limits and calculating acceleration time/distance
Post by: Mariculous on January 02, 2020, 06:17:42 PM
Post by: Mariculous on January 02, 2020, 06:17:42 PM
We had already discussed this in another thread.
I still think the only really useful acceleration information is something like "accelerates to n km/h in x km or tiles", where n can be chosen by the player.
Especially steam engines don't reach their vmax often and later on for stopping services it may be of much more interesst to know how quick a train that is mainly used at 120 km/h whill reach that 120 km/h instead of trains maximum speed of e.g. 140 km/h
Same foes for tube trains whkch can't reach tvekr full speed in tube tunnels or any other train service that has short stop distances so it doesn't really matter how fast they reach maximum speed as they won't accelerate to that speed pretty often.
To compare trains even better, we need to calculate and display trains travel times for a given line, which is currently indev afaik.
Title: Re: Viewing curve speed limits and calculating acceleration time/distance
Post by: DrSuperGood on January 02, 2020, 07:13:35 PM
Post by: DrSuperGood on January 02, 2020, 07:13:35 PM
Acceleration slows as higher speeds are approached due to increased losses. Hence a simple metric of one point of acceleration that is not very useful.
This is why I recommended acceleration against speed graphs to show acceleration to the player. This instantly gives the player feedback as to what a reasonable to obtain speed for the vehicle would be since when acceleration is just 1 or less km/hour/sec it will likely not reach or progress past those speeds. The player could also set a load weight for the graph simulating some volume of goods being transported since weight affects acceleration.
This is why I recommended acceleration against speed graphs to show acceleration to the player. This instantly gives the player feedback as to what a reasonable to obtain speed for the vehicle would be since when acceleration is just 1 or less km/hour/sec it will likely not reach or progress past those speeds. The player could also set a load weight for the graph simulating some volume of goods being transported since weight affects acceleration.
Title: Re: Viewing curve speed limits and calculating acceleration time/distance
Post by: Mariculous on January 02, 2020, 07:58:48 PM
Post by: Mariculous on January 02, 2020, 07:58:48 PM
A graph is also fine but speed/acceleration is not what players usually want to know. They are usually interessted in speed/distance or speed/time.
Title: Re: Viewing curve speed limits and calculating acceleration time/distance
Post by: Ranran(retired) on January 03, 2020, 01:13:04 AM
Post by: Ranran(retired) on January 03, 2020, 01:13:04 AM
The acceleration I displayed in the testing dialog above is strictly called startup acceleration(起動加速度 in Japanese), and is often used in the Japanese railway to express vehicle specifications.
For example, the startup acceleration of a Class 800, known as Azuma, is 2.52 km/h/s (0.70 m/s/s), which is the startup acceleration value.
The following is the relevant article on Japanese wikipedia, but I could not find any English article that covered the same content.
https://ja.wikipedia.org/wiki/%E8%B5%B7%E5%8B%95%E5%8A%A0%E9%80%9F%E5%BA%A6
The acceleration is constant from speed 0 to the rated speed as shown in the graph in that article. This is a characteristic of electric motors, but in simutrans extended, all powered vehicles show the rated speed, and we speculate that diesel engines may also behave like electric motors. In that case, even in the case of a diesel engine, it should be correct as an in-game specification.
(Currently the unit of tractive effort uses an integer kN and is so crude that it causes some computational errors when compared to the real one.)
It should be noted that the acceleration calculated above is estimated from the vehicle spec in the game, and is not an actual measurement of the convoy movement in the game.
I do not know how the slowdown of acceleration after exceeding the rated speed is handled in extended. In the real world, the tractive force when exceeding the rated speed can be confirmed by looking at the power notch curve, but I do not know what this formula is. Perhaps this depends on the motor, so the parameters needed for the calculation may be missing.
However, if you know the formula, you can also estimate the mileage and acceleration time.
Also, doing that calculation in convoy instead of a single vehicle can be more complicated. Because different motors have different characteristics.
When vehicles with different rated speeds are mixed in the convoy, the acceleration curve becomes complicated.
Issue
It looks like its display is already too long and may conflict with cargo capacity list.
EDIT:
I can't affirm it because I haven't played the transport fever so much yet, but the transport fever doesn't seem to simulate slowing acceleration at high speeds. Anyway, even at low speed, acceleration is slow and frustrating. :heart:
In that case, the calculation of the acceleration distance will be easy.
For example, the startup acceleration of a Class 800, known as Azuma, is 2.52 km/h/s (0.70 m/s/s), which is the startup acceleration value.
The following is the relevant article on Japanese wikipedia, but I could not find any English article that covered the same content.
https://ja.wikipedia.org/wiki/%E8%B5%B7%E5%8B%95%E5%8A%A0%E9%80%9F%E5%BA%A6
The acceleration is constant from speed 0 to the rated speed as shown in the graph in that article. This is a characteristic of electric motors, but in simutrans extended, all powered vehicles show the rated speed, and we speculate that diesel engines may also behave like electric motors. In that case, even in the case of a diesel engine, it should be correct as an in-game specification.
QuoteThe acceleration of (fast) passenger cars is often specified as the time needed to accelerate from 0 to 100 km/h. Although the acceleration is not constant, it can be estimated from km/h/s (x100).This complicates the calculation because the acceleration force is not constant above the rated speed. Finding the acceleration in the constant torque range is very easy because the calculation formula is simple.
(Currently the unit of tractive effort uses an integer kN and is so crude that it causes some computational errors when compared to the real one.)
It should be noted that the acceleration calculated above is estimated from the vehicle spec in the game, and is not an actual measurement of the convoy movement in the game.
I do not know how the slowdown of acceleration after exceeding the rated speed is handled in extended. In the real world, the tractive force when exceeding the rated speed can be confirmed by looking at the power notch curve, but I do not know what this formula is. Perhaps this depends on the motor, so the parameters needed for the calculation may be missing.
However, if you know the formula, you can also estimate the mileage and acceleration time.
Also, doing that calculation in convoy instead of a single vehicle can be more complicated. Because different motors have different characteristics.
When vehicles with different rated speeds are mixed in the convoy, the acceleration curve becomes complicated.
Issue
It looks like its display is already too long and may conflict with cargo capacity list.
EDIT:
I can't affirm it because I haven't played the transport fever so much yet, but the transport fever doesn't seem to simulate slowing acceleration at high speeds. Anyway, even at low speed, acceleration is slow and frustrating. :heart:
In that case, the calculation of the acceleration distance will be easy.
Title: Re: Viewing curve speed limits and calculating acceleration time/distance
Post by: DrSuperGood on January 03, 2020, 05:15:13 AM
Post by: DrSuperGood on January 03, 2020, 05:15:13 AM
Quote from: Freahk on January 02, 2020, 07:58:48 PMspeed/distanceNot that meaningful due to how the two relate. Where as speed and acceleration are finite, distance is not. It is not clearly showing the acceleration.
This is the sort of value that a field could calculate if queried by the player. For example the player could request to know what speed the vehicle will reach in 10km, or what distance would be required to reach 100km/h. These have applications for some kinds of line optimization, but generally does not give an idea of how quickly a train reaches a functional speed.
A possible use case for this might be optimizing distances between stops to reach a desired average speed. However such graph would not be showing the deceleration required so is not useful for this anyway. Instead another graph would be needed, average speed against distance between stops. The graph could have some reasonable upper limit such as 90% of the maximum speed at which distance the convoys would be operating very efficiently irrespective of acceleration.
Quote from: Freahk on January 02, 2020, 07:58:48 PMspeed/timeThis is more meaningful and gives the player an idea of how quickly it will reach a reasonable speed. If one has a cut-off of 5 or 10 minutes of acceleration then one gets a reasonable idea of what practical speed a vehicle might reach.
Quote from: Freahk on January 02, 2020, 07:58:48 PMA graph is also fine but speed/acceleration is not what players usually want to know.It still has value with respect to knowing how well the vehicle accelerates when at speed. When the acceleration (Y axis) is low then that is likely a speed that is not reasonable to obtain.
The point of graphs would be to help the player visualize what they could expect from their vehicles. For example their steam engine train configuration might have a maximum speed of 120 km/h but looking at the graphs that speed is in a very bad place for acceleration, so something like 90-100 km/h would be more reasonable to expect it to run at as acceleration is good up until then.
Quote from: Ranran on January 03, 2020, 01:13:04 AMThe acceleration is constant from speed 0 to the rated speed as shown in the graph in that article. This is a characteristic of electric motors, but in simutrans extended, all powered vehicles show the rated speed, and we speculate that diesel engines may also behave like electric motors. In that case, even in the case of a diesel engine, it should be correct as an in-game specification.Any UI system needs to be pretty general and apply to steam and other vehicle types as well. It also must return values which are consistent with the physics used to move the vehicles rather than to real life directly.
Title: Re: Viewing curve speed limits and calculating acceleration time/distance
Post by: Ranran(retired) on January 03, 2020, 06:22:21 AM
Post by: Ranran(retired) on January 03, 2020, 06:22:21 AM
I found something in the code, is this still visible on the GUI?
Code Select
#ifdef ACCELERATION_BUTTON
		//Bernd Gabriel, Sep, 24 2009: acceleration curve:
		if (filterButtons[ACCELERATION_BUTTON].is_visible() && filterButtons[ACCELERATION_BUTTON].pressed)
		{
			const int akt_speed_soll = kmh_to_speed(convoy.calc_max_speed(convoy.get_weight_summary()));
			float32e8_t akt_v = 0;
			sint32 akt_speed = 0;
			sint32 sp_soll = 0;
			int i = MAX_MONTHS;
			physics_curves[--i][0] = akt_speed;
			while (i > 0)
			{
				convoy.calc_move(welt->get_settings(), 15 * 64, akt_speed_soll, akt_speed_soll, SINT32_MAX_VALUE, SINT32_MAX_VALUE, akt_speed, sp_soll, akt_v);
				physics_curves[--i][0] = speed_to_kmh(akt_speed);
			}
		}
#endif
Title: Re: Viewing curve speed limits and calculating acceleration time/distance
Post by: Qayyum on January 03, 2020, 09:30:44 AM
Post by: Qayyum on January 03, 2020, 09:30:44 AM
When pressure out of engine = pressure into the engine, acceleration is countered by equal drag, you get maximum operable speed.
Title: Re: Viewing curve speed limits and calculating acceleration time/distance
Post by: jamespetts on January 03, 2020, 11:25:30 AM
Post by: jamespetts on January 03, 2020, 11:25:30 AM
Quote from: Ranran on January 03, 2020, 06:22:21 AM
I found something in the code, is this still visible on the GUI?Code Select
#ifdef ACCELERATION_BUTTON
		//Bernd Gabriel, Sep, 24 2009: acceleration curve:
		if (filterButtons[ACCELERATION_BUTTON].is_visible() && filterButtons[ACCELERATION_BUTTON].pressed)
		{
			const int akt_speed_soll = kmh_to_speed(convoy.calc_max_speed(convoy.get_weight_summary()));
			float32e8_t akt_v = 0;
			sint32 akt_speed = 0;
			sint32 sp_soll = 0;
			int i = MAX_MONTHS;
			physics_curves[--i][0] = akt_speed;
			while (i > 0)
			{
				convoy.calc_move(welt->get_settings(), 15 * 64, akt_speed_soll, akt_speed_soll, SINT32_MAX_VALUE, SINT32_MAX_VALUE, akt_speed, sp_soll, akt_v);
				physics_curves[--i][0] = speed_to_kmh(akt_speed);
			}
		}
#endif
I believe not, as the relevant preprocessor directive is not defined. I am not quite sure what happened to this in the end; I suspect that it may be incomplete, but I am not sure how incomplete.
Title: Re: Viewing curve speed limits and calculating acceleration time/distance
Post by: Mariculous on January 03, 2020, 12:38:08 PM
Post by: Mariculous on January 03, 2020, 12:38:08 PM
Speed/tiles or time/tiles is what players are interessted in. The only thing one could read from speed/acceleration is a guess for maximum expected speed but it's hard to guess from that gurve how much distance it will need to get to that point.
Thus, this information might be roughly useful for long distance trains, It is nearly useless for stopping trains and I don't think it's much harder to see where the speed/tiles curve becomes roughly flat, compared to see where acceleration/time curve gets close to 0.
However, these all seem to be useful in some case, so maybe we could add multiple graphs just like in any other graph window, where we can select which graph to show. We have to make changes to current graph display in either cases anyway bcecause tve current grid is too large.
Useful canditates would be imho v/t: easyest to compare acceleration performance to a given speed but not easy to understand how long the distance has to be to reach a given speed.
v/d: roughly the same as v/t but one can immediately see how much distance is needed to reach a given speed. The downside of this is that the curve will flatten the faster the train gets even if acceleration was constant.
v/a: we can immediately see the acceleration at a given speed, so we can also see where our trains speed is capped, which can be useful for long stop distances but it's not pretty useful to compare vehicles for short stop distances especially if their characteristics are different e.g. one has a high starting acceleration but can't hold it for a long time (high tractive effort, low power) where the other one has a lower starting acceleration that it can hold up much longer (low tractive effort, high power)
Quote from: DrSuperGood on January 03, 2020, 05:15:13 AMFor a stopping train, I want to know if I can expect a vehicle to reach a given speed roughly as fast as another vehicle. Comparing acceleration c
The point of graphs would be to help the player visualize what they could expect from their vehicles.
Title: Re: Viewing curve speed limits and calculating acceleration time/distance
Post by: Vladki on January 03, 2020, 02:13:28 PM
Post by: Vladki on January 03, 2020, 02:13:28 PM
I think that the starting acceleration suggested by ranran is enough for comparison purposes. I guess it is as simple as
Code Select
acceleration = tractive_force / conwoy_weight
Title: Re: Viewing curve speed limits and calculating acceleration time/distance
Post by: jamespetts on January 03, 2020, 02:33:51 PM
Post by: jamespetts on January 03, 2020, 02:33:51 PM
Quote from: Vladki on January 03, 2020, 02:13:28 PM
I think that the starting acceleration suggested by ranran is enough for comparison purposes. I guess it is as simple asCode Selectacceleration = tractive_force / conwoy_weight
A basic metric of acceleration is likely to be sufficient for comparison; but do we want more than comparison? And, if we do, is the more than comparison that we want more than Ranran can sensibly code in a reasonable time?
Also, it is not as simple as acceleration = tractive effort / total weight, as steam engines have different acceleration physics compared to other types of vehicle; there is also the issue of some vehicles having a lower aerodynamic drag (as specified in the .dat files) and different waytypes having different rolling resistance to overcome.
Title: Re: Viewing curve speed limits and calculating acceleration time/distance
Post by: Vladki on January 03, 2020, 02:46:53 PM
Post by: Vladki on January 03, 2020, 02:46:53 PM
I think starting acceleration is enough for the game purpose - we get 80% precision with 20% effort. Further improvements (remaining 20% of precision) would require another 80% effort. (Or was the rule 10/90 ?)
Aerodynamic drag depends on speed - so it can be ignored in starting acceleration when speed is 0. So how about:
Maybe two values would be interesting - for empty and fully loaded convoy.
Aerodynamic drag depends on speed - so it can be ignored in starting acceleration when speed is 0. So how about:
Code Select
acceleration = (tractive_force - rolling resistance) / conwoy_weightMaybe two values would be interesting - for empty and fully loaded convoy.
Title: Re: Viewing curve speed limits and calculating acceleration time/distance
Post by: Qayyum on January 03, 2020, 04:12:38 PM
Post by: Qayyum on January 03, 2020, 04:12:38 PM
Drag (rolling resistance) can be measured by considering air pushing the surface area facing front when front face is straight. When front face is slanted, air pushing surface area slanted be less force.
Title: Re: Viewing curve speed limits and calculating acceleration time/distance
Post by: DrSuperGood on January 03, 2020, 06:55:55 PM
Post by: DrSuperGood on January 03, 2020, 06:55:55 PM
Quote from: Vladki on January 03, 2020, 02:46:53 PMI think starting acceleration is enough for the game purposeWhen playing on the bridgewater brunel server I never had issues with starting acceleration. I always had issues with guessing maximum reasonably obtainable speed for steam engines. My steam engines ratted at 120 km/h would struggle to get anywhere near that despite having sufficient power due to the very low acceleration at higher speeds.
Title: Re: Viewing curve speed limits and calculating acceleration time/distance
Post by: Vladki on January 03, 2020, 07:31:25 PM
Post by: Vladki on January 03, 2020, 07:31:25 PM
Quote from: DrSuperGood on January 03, 2020, 06:55:55 PM
When playing on the bridgewater brunel server I never had issues with starting acceleration. I always had issues with guessing maximum reasonably obtainable speed for steam engines. My steam engines ratted at 120 km/h would struggle to get anywhere near that despite having sufficient power due to the very low acceleration at higher speeds.
Then, it would be nice to have the value how many km it takes (on straight level track) to gain full speed. Just an opposite of braking distance.
If the convoy is too heavy, then the max possible speed with given weight.
Title: Re: Viewing curve speed limits and calculating acceleration time/distance
Post by: Mariculous on January 03, 2020, 07:54:59 PM
Post by: Mariculous on January 03, 2020, 07:54:59 PM
If the convoy is too heavy, distance to reach max possible speed is pretty meaningless as it will be very high and reaching a little bit less speed will require drastically less distance.
That's why either a user selectable speed or a graph should be used.
Also note, the calculating acceleration time/distance part of this thread seems to be strongly related to https://forum.simutrans.com/index.php/topic,19363.0.html, so I won't add it to the feature request list.
If you feel it is not related, please let me know so I will add this.
The Viewing curve speed limits part would require an other approach to curve speeds, which would be nice for usability reasons, but I don't think it is something that is of high priority. Also let me know if you think it is of high priority or should be added to the list nevertheless.
Title: Re: Viewing curve speed limits and calculating acceleration time/distance
Post by: Ranran(retired) on January 06, 2020, 06:02:29 AM
Post by: Ranran(retired) on January 06, 2020, 06:02:29 AM
Quote from: jamespetts on January 03, 2020, 11:25:30 AMI believe not, as the relevant preprocessor directive is not defined. I am not quite sure what happened to this in the end; I suspect that it may be incomplete, but I am not sure how incomplete.First of all, I really appreciate Bernd Gabriel's big job. :award:
I found he tried to implement the acceleration chart in the code but noticed it wasn't working properly.
So, I tried fixing it.
It was something like this. 8)

Now you can test it. My github branch is here :arrow:
https://github.com/Ranran-the-JuicyPork/simutrans-extended/tree/dig-acceleration-curve-chart
memo:
The position of the Acceleration button is weird, but I didn't know how to fix it. (At first it was in a more weird place) (´・ω・`)
Title: Re: Viewing curve speed limits and calculating acceleration time/distance
Post by: Ranran(retired) on January 06, 2020, 07:20:02 AM
Post by: Ranran(retired) on January 06, 2020, 07:20:02 AM
Back to the thread theme, I confirmed that we can get tractive force for each speed with the following code.
(This is the value multiplied by gear and it is currently used too.)
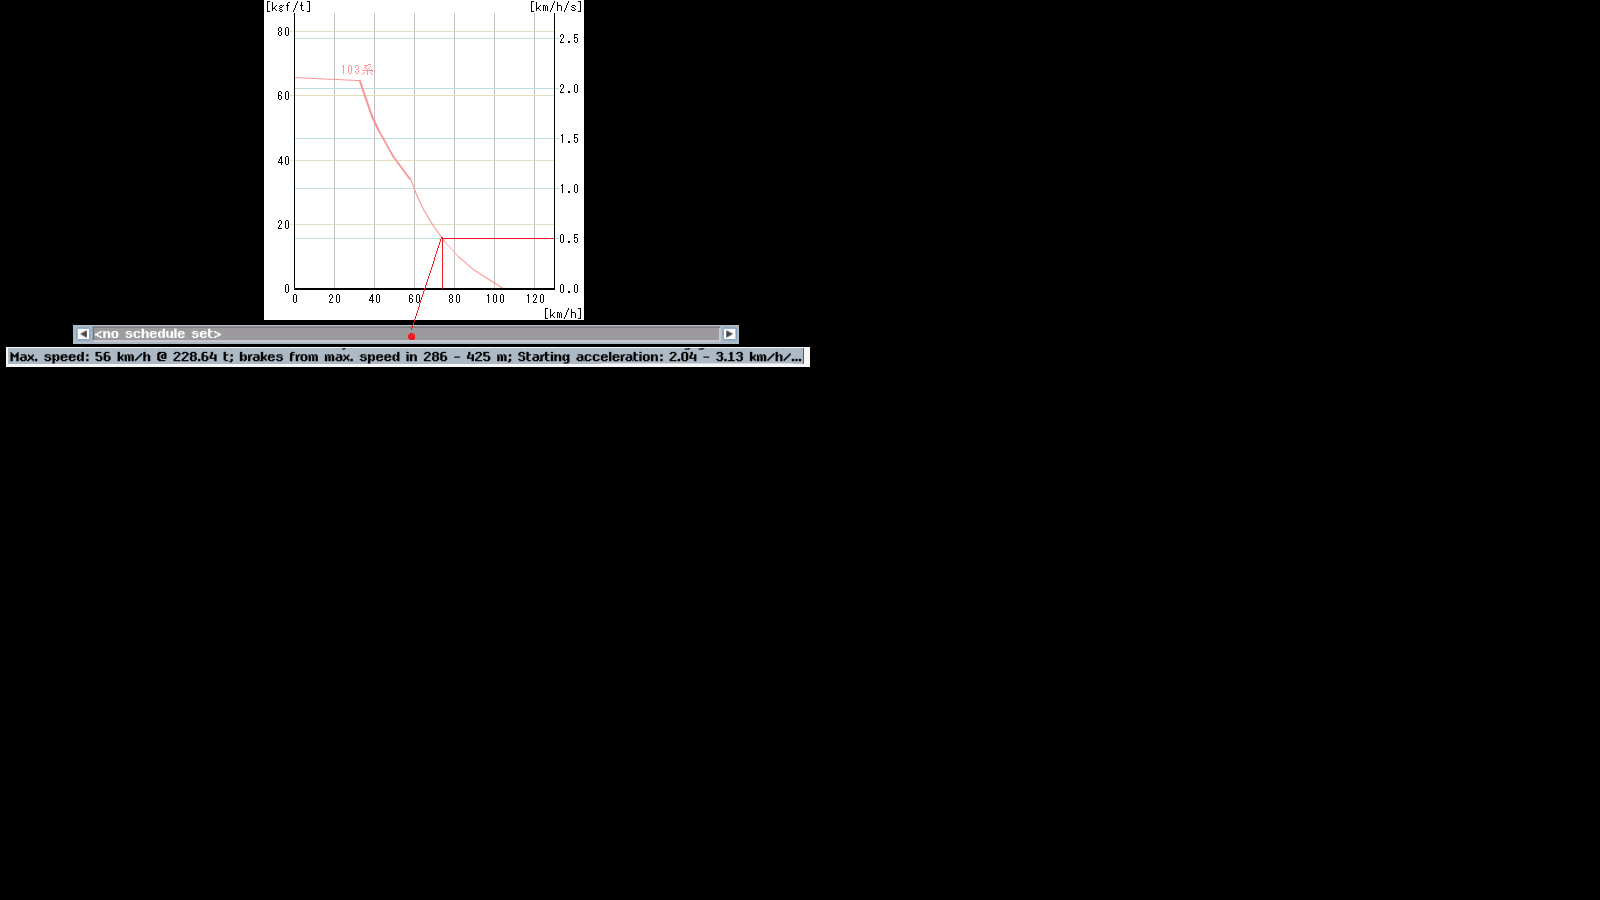
Using this (get tractive force every 1km/h up to maximum speed), it will be easy to draw the notch curve like this

This does not care that different rated speeds are mixed.
And if it display a resistance chart here, we may understand the importance of the streamline of high-speed trains :)
Such charts, including the BG's chart introduced in the previous post, are very useful, but they can't fit in the depot dialog.
Therefore, I think simple displays such as starting acceleration are still useful.
The chart will give you a clear visual understanding of the difference. But it is difficult to explain it in short texts.
Then I found it easy to apply the above function to estimate the time and distance needed for acceleration.
However, IMO, the distance and time required for maximum speed is not useful information in extended. It may be useful for simutrans-standard and transport fever.
In Extended, the acceleration is attenuated in the high speed range as in reality.
And, like the difference in "the gear ratio" in the real world, there is a difference between a vehicle that is good at high speed driving and a vehicle that is not good at high speed.
It may take a long time to accelerate 1 km/h near the maximum speed. Especially when the speed is close to the balancing speed. The higher the maximum speed, the longer the distance traveled per second. As such, distance and seconds can be useless parameters, and that fact is easily overlooked.
Efforts to reach maximum speed for vehicles not good at high speeds overlook the fact that they are costly, resulting in unnecessary high costs.
For example, the vehicle in the graph above has a maximum speed of 100 km/h, but there is little tractive effort near 100 km/h. It is not advisable to pay any additional costs for reducing the distance and time for this vehicle to reach maximum speed. (´・ω・`)
The simple display of the starting acceleration is just one of the parameters for comparing vehicle performance when you feel the acceleration is slow.
If you feel that acceleration in the high-speed range is slow, you can check the rated speed of the powered vehicle and replace it with a vehicle with a higher rated speed.
In any case, making graphs will make them clearer.
The starting acceleration display patch is now in this state and repository is here
https://github.com/Ranran-the-JuicyPork/simutrans-extended/tree/display-the-starting-acceleration


As described above, there is a problem with the display space.
1) the excavation of Bernd Gabriel's buried acceleration chart. This may be useful in that thread. I think there is room for improvement, but the core calculation hasn't been touched so far.
2) Add a simple starting acceleration display to the depot dialog (improve convoy performance comparison)
If we need to calculate travel distance or acceleration time, I need to add a lot of formulas, but since I didn't that so far, this seems less relevant to that thread.
Code Select
cnv->get_force_summary(speed_to_v(cnv->get_akt_speed())).to_sint32()(This is the value multiplied by gear and it is currently used too.)
Using this (get tractive force every 1km/h up to maximum speed), it will be easy to draw the notch curve like this
This does not care that different rated speeds are mixed.
And if it display a resistance chart here, we may understand the importance of the streamline of high-speed trains :)
Such charts, including the BG's chart introduced in the previous post, are very useful, but they can't fit in the depot dialog.
Therefore, I think simple displays such as starting acceleration are still useful.
The chart will give you a clear visual understanding of the difference. But it is difficult to explain it in short texts.
Then I found it easy to apply the above function to estimate the time and distance needed for acceleration.
However, IMO, the distance and time required for maximum speed is not useful information in extended. It may be useful for simutrans-standard and transport fever.
In Extended, the acceleration is attenuated in the high speed range as in reality.
And, like the difference in "the gear ratio" in the real world, there is a difference between a vehicle that is good at high speed driving and a vehicle that is not good at high speed.
Quote from: DrSuperGood on January 03, 2020, 06:55:55 PMI always had issues with guessing maximum reasonably obtainable speed for steam engines. My steam engines ratted at 120 km/h would struggle to get anywhere near that despite having sufficient power due to the very low acceleration at higher speeds.The tractive force of a steam locomotive is almost lost at high speeds, leaving little propulsion. As you can see from the spec of the steam locomotives on the vehicle information, the rated speed is very low at around 10km/h. Steam locomotives and diesels have these characteristics, so I think they are the right settings.
It may take a long time to accelerate 1 km/h near the maximum speed. Especially when the speed is close to the balancing speed. The higher the maximum speed, the longer the distance traveled per second. As such, distance and seconds can be useless parameters, and that fact is easily overlooked.
Efforts to reach maximum speed for vehicles not good at high speeds overlook the fact that they are costly, resulting in unnecessary high costs.
For example, the vehicle in the graph above has a maximum speed of 100 km/h, but there is little tractive effort near 100 km/h. It is not advisable to pay any additional costs for reducing the distance and time for this vehicle to reach maximum speed. (´・ω・`)
The simple display of the starting acceleration is just one of the parameters for comparing vehicle performance when you feel the acceleration is slow.
If you feel that acceleration in the high-speed range is slow, you can check the rated speed of the powered vehicle and replace it with a vehicle with a higher rated speed.
In any case, making graphs will make them clearer.
The starting acceleration display patch is now in this state and repository is here
https://github.com/Ranran-the-JuicyPork/simutrans-extended/tree/display-the-starting-acceleration
As described above, there is a problem with the display space.
Quote from: Freahk on January 03, 2020, 07:54:59 PMAlso note, the calculating acceleration time/distance part of this thread seems to be strongly related to https://forum.simutrans.com/index.php/topic,19363.0.html, so I won't add it to the feature request list.I made two patches in this thread;
If you feel it is not related, please let me know so I will add this.
1) the excavation of Bernd Gabriel's buried acceleration chart. This may be useful in that thread. I think there is room for improvement, but the core calculation hasn't been touched so far.
2) Add a simple starting acceleration display to the depot dialog (improve convoy performance comparison)
If we need to calculate travel distance or acceleration time, I need to add a lot of formulas, but since I didn't that so far, this seems less relevant to that thread.
Title: Re: Viewing curve speed limits and calculating acceleration time/distance
Post by: jamespetts on January 06, 2020, 11:25:38 AM
Post by: jamespetts on January 06, 2020, 11:25:38 AM
This is very interesting work - thank you for this.
The acceleration graph - may I ask what units that the horizontal axis are in? Normally, the horizontal axis on the convoy graphs are in months, but clearly that is not the case with acceleration.
The starting acceleration display is interesting indeed, although the overlapping issue is unfortunate. I am not quite sure how to solve that. I should be interested in others' views on the significance of the starting acceleration display and the overlapping issue.
Title: Re: Viewing curve speed limits and calculating acceleration time/distance
Post by: Ranran(retired) on January 06, 2020, 12:05:09 PM
Post by: Ranran(retired) on January 06, 2020, 12:05:09 PM
Quote from: jamespetts on January 06, 2020, 11:25:38 AMThe acceleration graph - may I ask what units that the horizontal axis are in?
Code Select
convoy.calc_move(welt->get_settings(), 15 * 64, akt_speed_soll, akt_speed_soll, SINT32_MAX_VALUE, SINT32_MAX_VALUE, akt_speed, sp_soll, akt_v);
You can see from this code that he has assigned 15 * 64 to delta_t.
I don't know how many seconds this shows in the game, but I think it's about 4 seconds when estimated from the starting acceleration shown in the depot.
That means that it will probably show 44 seconds of acceleration in the chart.
Title: Re: Viewing curve speed limits and calculating acceleration time/distance
Post by: jamespetts on January 06, 2020, 01:51:27 PM
Post by: jamespetts on January 06, 2020, 01:51:27 PM
Quote from: Ranran on January 06, 2020, 12:05:09 PMCode Select
convoy.calc_move(welt->get_settings(), 15 * 64, akt_speed_soll, akt_speed_soll, SINT32_MAX_VALUE, SINT32_MAX_VALUE, akt_speed, sp_soll, akt_v);
You can see from this code that he has assigned 15 * 64 to delta_t.
I don't know how many seconds this shows in the game, but I think it's about 4 seconds when estimated from the starting acceleration shown in the depot.
That means that it will probably show 44 seconds of acceleration in the chart.
Interesting - thank you for working that out. Given that the horizontal axis is labelled 0 to 11, this is potentially confusing; I wonder whether there is a simple way of making this clearer to the player?
Title: Re: Viewing curve speed limits and calculating acceleration time/distance
Post by: Ves on January 06, 2020, 08:54:05 PM
Post by: Ves on January 06, 2020, 08:54:05 PM
Perhaps split the line of text in two, so you have one very long line with acceleration details, and the following line with braking details. The cost would be that the depot window will have to grow yet another line, but that arrangement would make sense I think.
As to what it should say, I still am a big fan of the more simple "accelerates to 100km/h in X seconds". Especially if the graphs doesnt fit in the depot! For more granularity more entries could be added:
"Accelerate to: 50km/h in X seconds; 100km/h in Y seconds; 167km/h (max speed) in Z seconds."
So if there is an unreasonably big gap between some of the intervals, it is pretty obvious that the vehicle doesnt accelerate very well in this speed region.
I like the graphs in the convoy info, that looks very "engineering like"! If also the axis'es could be declared.
Title: Re: Viewing curve speed limits and calculating acceleration time/distance
Post by: Qayyum on January 06, 2020, 09:18:45 PM
Post by: Qayyum on January 06, 2020, 09:18:45 PM
A slider would be convenient.
Title: Re: Viewing curve speed limits and calculating acceleration time/distance
Post by: jamespetts on January 06, 2020, 09:21:07 PM
Post by: jamespetts on January 06, 2020, 09:21:07 PM
The "accelerates to 100km/h in X seconds" is probably unworkable: there will be many convoys that cannot reach 100km/h at all (think of early freight trains and trams, for instance) and there will be many that take many, many minutes more to reach 100km/h than to reach 95km/h or even 99km/h; so this display does not give a useful general comparison between vehicles, nor does it provide (except in a few cases) a useful applied metric.
Ideally, one would have an adjustable applied metric (accelerates to Xkm/h in Ykm, with players able to alter either X or Y and the other of the two numbers being calculated), but I anticipate that this may be a lot more work for RanRan. However, it is better to have at least some comparison of acceleration than none.
Ideally, one would have an adjustable applied metric (accelerates to Xkm/h in Ykm, with players able to alter either X or Y and the other of the two numbers being calculated), but I anticipate that this may be a lot more work for RanRan. However, it is better to have at least some comparison of acceleration than none.
Title: Re: Viewing curve speed limits and calculating acceleration time/distance
Post by: Mariculous on January 06, 2020, 10:07:10 PM
Post by: Mariculous on January 06, 2020, 10:07:10 PM
Quote from: Freahk on November 23, 2019, 12:07:27 AMSo what I suggest is the follwing two things:
1. Show "accelerates to <selectable speed> in ... seconds" in the depot for a given train, to get a rough overview of acceleration of a train.
2. Show calculated travel times for full and empy trains (maybe also not overcrowded full times) in between stations in the "times history" window.
The first just seems to be what you suggested ;)
The second is just for completeness. Afaik it's WIP but don't know for sure.
Title: Re: Viewing curve speed limits and calculating acceleration time/distance
Post by: jamespetts on January 06, 2020, 10:48:34 PM
Post by: jamespetts on January 06, 2020, 10:48:34 PM
Qayyum - a slider might be a fairly easy interaction for the player, but I suspect that it would be difficult to code as there is no existing control in Simutrans in the form of a slider.
Freahk - yes, there is some sense in that suggestion; but the question is whether Ranran is realistically able to code this within a reasonable time.
Freahk - yes, there is some sense in that suggestion; but the question is whether Ranran is realistically able to code this within a reasonable time.
Title: Re: Viewing curve speed limits and calculating acceleration time/distance
Post by: Qayyum on January 07, 2020, 07:58:28 AM
Post by: Qayyum on January 07, 2020, 07:58:28 AM
Maybe 'change numbers as convoy added'?
Title: Re: Viewing curve speed limits and calculating acceleration time/distance
Post by: Ranran(retired) on January 07, 2020, 10:05:33 AM
Post by: Ranran(retired) on January 07, 2020, 10:05:33 AM
Thank you for your feedback. Ranran eats it and gets fat and more juicy.
Let's clear the issue one by one. Ranran are an army of used up freaks. (´・ω・`)
About Bernd Gabriel's acceleration chart, I have made some jalapagonize to it. Please taste it, you sommeliers.

1) Acceleration chart is exclusive with other charts. Now the acceleration chart is a lonely wolf.
This is to resolve unit conflicts.
2) The x-axis of the acceleration display has been increased due to the benefit of 1). About 1 minute acceleration is displayed every 2.5 seconds.
Why 2.5 seconds? Good question. The x-axis has different colors alternately. Two axes are 5 seconds and four axes are 10 seconds.
And, when displaying Acceleration, the unit of the x-axis was hidden.
This is because the x-axis of the current lazy chart can start at a specific number, such as a specific year, but can only count in increments of one and try to display it all.
I thought it would take time to change this. So Ranran is also lazy. (´・ω・`)
3) I have set a tooltip for these chart buttons since currently no tooltip has been set.
Note that since I do not speak English, the same text as the button is currently set as a dummy.
Anyone who speaks the right English can help with this edit.
The tooltip that should be displayed for "acceleration" would be something like:
(direct translation of my Japanese by Dr. google translate)
4) This acceleration chart has been changed so that the direction of the graph is fixed regardless of the setting of left_to_right_graphs.
Hope for more feedback. Thank you.
Let's clear the issue one by one. Ranran are an army of used up freaks. (´・ω・`)
About Bernd Gabriel's acceleration chart, I have made some jalapagonize to it. Please taste it, you sommeliers.
1) Acceleration chart is exclusive with other charts. Now the acceleration chart is a lonely wolf.
This is to resolve unit conflicts.
2) The x-axis of the acceleration display has been increased due to the benefit of 1). About 1 minute acceleration is displayed every 2.5 seconds.
Why 2.5 seconds? Good question. The x-axis has different colors alternately. Two axes are 5 seconds and four axes are 10 seconds.
And, when displaying Acceleration, the unit of the x-axis was hidden.
This is because the x-axis of the current lazy chart can start at a specific number, such as a specific year, but can only count in increments of one and try to display it all.
I thought it would take time to change this. So Ranran is also lazy. (´・ω・`)
3) I have set a tooltip for these chart buttons since currently no tooltip has been set.
Note that since I do not speak English, the same text as the button is currently set as a dummy.
Anyone who speaks the right English can help with this edit.
The tooltip that should be displayed for "acceleration" would be something like:
Code Select
This chart shows how the convoy accelerates for one minute.(direct translation of my Japanese by Dr. google translate)
Code Select
static const char cost_tooltip[BUTTON_COUNT][128] =
{
	"Free Capacity",
	"Transported",
	"Average speed",
	"Comfort",
	"Revenue",
	"Operation",
	"Profit",
	"Distance",
	"Refunds"
	//, "Maxspeed"
	//, "Way toll"
	, "This chart shows how the convoy accelerates for one minute."
};
4) This acceleration chart has been changed so that the direction of the graph is fixed regardless of the setting of left_to_right_graphs.
Hope for more feedback. Thank you.
Title: Re: Viewing curve speed limits and calculating acceleration time/distance
Post by: Qayyum on January 07, 2020, 10:26:30 AM
Post by: Qayyum on January 07, 2020, 10:26:30 AM
Code Select
This chart shows how the convoy accelerates for one minute.Can be changed to this"
Code Select
This chart shoes the behaviour of convoy when moving forward constantly from start of journey to one minute after, assuming no junctions.
Title: Re: Viewing curve speed limits and calculating acceleration time/distance
Post by: Ranran(retired) on January 07, 2020, 10:50:19 AM
Post by: Ranran(retired) on January 07, 2020, 10:50:19 AM
Quote from: Qayyum on January 07, 2020, 10:26:30 AMThis chart shoes the behaviour of convoy when moving forward constantly from start of journey to one minute after, assuming no junctions.Thank you for the proofreading.
The content is correct, but I think it's too long to show in the tooltip. Is it possible to shorten it a little further?
Title: Re: Viewing curve speed limits and calculating acceleration time/distance
Post by: jamespetts on January 07, 2020, 11:13:59 AM
Post by: jamespetts on January 07, 2020, 11:13:59 AM
Thank you for your work on this. One question about units again, if I may: does "one minute" here refer to a minute in real time or in-game time? The latter would be more useful, I think.
Title: Re: Viewing curve speed limits and calculating acceleration time/distance
Post by: Ranran(retired) on January 07, 2020, 11:34:54 AM
Post by: Ranran(retired) on January 07, 2020, 11:34:54 AM
Quote from: jamespetts on January 07, 2020, 11:13:59 AMOne question about units again, if I may: does "one minute" here refer to a minute in real time or in-game time? The latter would be more useful, I think.I inferred that it was one minute from the acceleration display calculated from the traction force displayed in the depot. When confirmed in the game, it seems to match 1 minute in the game.
Title: Re: Viewing curve speed limits and calculating acceleration time/distance
Post by: jamespetts on January 07, 2020, 12:59:06 PM
Post by: jamespetts on January 07, 2020, 12:59:06 PM
Quote from: Ranran on January 07, 2020, 11:34:54 AM
I inferred that it was one minute from the acceleration display calculated from the traction force displayed in the depot. When confirmed in the game, it seems to match 1 minute in the game.
Splendid, thank you for confirming: that is very helpful. This does look very interesting. It will not be practical for me to test this until I get home next week, but I should in the meantime be interested in others' feedback on how useful that this feature is likely to be. Since it has already been coded, it only needs to be slightly useful (and not cause any other problems) to be integrated.
The real question is whether the extra space taken in the convoy overview window with charts is worth the extra data: I should be interested in players' views on that question.
Title: Re: Viewing curve speed limits and calculating acceleration time/distance
Post by: Qayyum on January 07, 2020, 01:49:46 PM
Post by: Qayyum on January 07, 2020, 01:49:46 PM
Code Select
This chart shoes the behaviour of convoy when moving forward constantly from start of journey to one minute after, assuming no junctions.To RanRan: Let me see...
Code Select
This chart shows constant acceleration of convoy in one minute after departing. One minute in-game.
Title: Re: Viewing curve speed limits and calculating acceleration time/distance
Post by: Mariculous on January 07, 2020, 04:52:52 PM
Post by: Mariculous on January 07, 2020, 04:52:52 PM
QuoteThe real question is whether the extra space taken in the convoy overview window with charts is worth the extra data: I should be interested in players' views on that question.Generally, I think such a graph (velocity/time graph if I read it correctly) could be worth the space and we could hide the charts, just as the vehicle window does, so people with small resolutions are not too much affected by scrollbars or whatever.
However, what makes me unsure if it's worth is the fixed 1s x-axis, as I suspect that short time is not sufficient to compare characteristics of long-distance trains, which need longer to accelerate, especially for older steam or diesel trains.
Would it require much more work to add meaningful labels to the x-axis and scaling the x-axis by a calculated value?
It would be much more useful to display the graph up to a point where the acceleration becomes reasonably small (hardcoded threshold)
Additionally, I would suggest adding an acceleration/velocity diagram, as it was considered useful in the discussion and we get it nearly for free. The only thing we have to do is turning the values obtained by get_force_summary divided by mass into a graph.
Title: Re: Viewing curve speed limits and calculating acceleration time/distance
Post by: Qayyum on January 07, 2020, 06:26:42 PM
Post by: Qayyum on January 07, 2020, 06:26:42 PM
Jamespetts, I think this feature is useful. I would use to determine how many wagons can I have at maximum, referring to the condition of route itself.
Title: Re: Viewing curve speed limits and calculating acceleration time/distance
Post by: Ranran(retired) on January 09, 2020, 11:36:00 AM
Post by: Ranran(retired) on January 09, 2020, 11:36:00 AM
Quote from: jamespetts on January 07, 2020, 12:59:06 PMThe real question is whether the extra space taken in the convoy overview window with charts is worth the extra data: I should be interested in players' views on that question.The chart is foldable and no buttons are displayed when the chart is folded.
Somehow there is room for one button, but I'm guessing this was originally intended by Bernd Gabriel.
I think this "empty" is meaningful to show that the chart is exclusive. Also other charts show monthly data, acceleration chart is not based on that rule.
On the other hand, this chart may be unnecessary information for a specific waytype. For example, air waytype. I'm not convinced that this is unnecessary for ships, but I don't think it makes sense if player can't change its formation. We always have to accept its performance. If acceleration is abnormal, it is a pakset setting error.
Thus, it would be possible to remove it from the airplane convoy dialog.
Quote from: Freahk on January 07, 2020, 04:52:52 PMHowever, what makes me unsure if it's worth is the fixed 1s x-axis, as I suspect that short time is not sufficient to compare characteristics of long-distance trains, which need longer to accelerate, especially for older steam or diesel trains.I edited the gui_chart_t code of the x-axis so that I could change the settings of the x-axis labels. As a result, the x-axis has been expanded to 120 seconds.

However, varying the x-axis has some complexities and issues. X-axis scaling, axis labels do not look good etc.
Bernd's chart is influenced by changes in the maximum speed of the track/signal and the weight of the convoy. So it is necessary to calculate the maximum speed arrival time in the worst case in advance and determine the x axis first.
It's not impossible but takes more work.
The same scale may make it easier to see poor acceleration. I would like to ask everyone's opinion on whether 120 seconds is inadequate and in this regard.
QuoteAdditionally, I would suggest adding an acceleration/velocity diagram, as it was considered useful in the discussion and we get it nearly for free. The only thing we have to do is turning the values obtained by get_force_summary divided by mass into a graph.I don't think a(or F)-t graphs are useful; Acceleration is clear from the v-t graph; Strictly, time does not directly affect acceleration (or tractive force);
get_force_summary returns a value regardless of the maximum speed of convoy. In other words, it returns the full power value whether it is coasting or decelerating.
Bernd's chart is influenced by the current convoy status. In some cases, the maximum speed of the track is lower than the maximum speed of the convoy, in which case it does not accelerate (also in the chart), so we need to switch to a force for coasting to resolve the inconsistency. It takes a bit of work, but I don't think that chart is worth it for the reasons mentioned above, so I suggest the following F-v graph:


As I mentioned in a previous post, this is a graph often used to characterize motor vehicles. The upper line represents tractive effort, and the lower line represents running resistance. The difference between them is the accerelation force.
Judging from recent demands related to physical codes,
Quote from: jamespetts on October 07, 2011, 01:29:05 AMFractional power and tractive effort values[*S]I suppose it's time to make this change. As you can see from the chart above, the tractive force of the vehicle can currently only be specified in kN units, but it is actually calculated in N units. In real world, many vehicle specifications actually use finer units than kN.
Currently, it is only possible to specify power and tractive effort in units of kilowatts or kilonewtons. This is problematic for very low powered vehicles (e.g., bicycles, horses), as it is not possible to set realistic values for power. Internally, the physics engine can cope with fractional values of power and tractive effort, and it is possible to work around this to some extent for power by using "gear", but this is not effective for tractive effort.
It would thus be useful to be able to specify power and tractive effort as decimals of up to two decimal places (in the same way that weight can now be specified as a decimal). This should be relatively straightforward to implement, but does require some work in altering the memory structures to accommodate it.
Title: Re: Viewing curve speed limits and calculating acceleration time/distance
Post by: Mariculous on January 09, 2020, 01:20:59 PM
Post by: Mariculous on January 09, 2020, 01:20:59 PM
QuoteI don't think a(or F)-t graphs are useful;I fear, I can't follow this. You are talking about an a/t or F/t diagram, while I suggested an a/v diagram.
The implemented f/v diagram is just the same as the suggested a/v diagram, apart from a constant factor, which is effectively a y-scaling, so I'm totally fine with that implementation.
Additionally, adding the running resistance to the graph is a good idea in my opinion.
QuoteHowever, varying the x-axis has some complexities and issues. X-axis scaling, axis labels do not look good etc.That given, I would stick with the fixed 120s for now and change it later on if we encounter this to be insufficient for some vehicles.
Title: Re: Viewing curve speed limits and calculating acceleration time/distance
Post by: Ranran(retired) on January 09, 2020, 02:12:33 PM
Post by: Ranran(retired) on January 09, 2020, 02:12:33 PM
Quotewhile I suggested an a/v diagram.Sorry, you said "we get it nearly for free" so I thought it meant a graph where the x axis is t. And I didn't think that you meant was to point to the same thing as I showed in Reply # 29.
The F-v chart I proposed is not related to Bernd's chart code. Because that chart gets convoy data for each delta_t.
I chose the y-axis to be F (do not subtract the resistance) instead of a because I wanted to show the effect of running resistance on high-speed vehicles.
Ideally, make labels for F and a on the y-axis, but that would take extra effort.
I think that the tractive effort chart will complement the acceleration of 120s over (not seen in the chart) to some extent.
The slowness of acceleration at high speed can be found by looking at the tractive effort chart.
And the speed after 60 seconds and 120 seconds can be used as one barometer to compare the performance of convoy. Therefore I like fixing the axis (for a convoy already in operation).
EDIT:
I added to the convoy info dialog this time, but The ideal is to be able to see the F-v graph when assembling the convoy at the depot. (maybe open another dialog or switch tabs)
Preferably, a graph showing the acceleration time up to the maximum time is also displayed there.
Now that we know that we can display two charts with one button, we should be able to show two charts, the maximum load and the minimum load.
Title: Is the "Refunds" chart button broken?
Post by: Ranran(retired) on January 16, 2020, 10:57:32 AM
Post by: Ranran(retired) on January 16, 2020, 10:57:32 AM
One odd button margin seems to be for the "Refunds" button to appear under certain conditions.
So the extra space that James is concerned about can already be created by this "Refunds" button but I have never seen this "Refunds" button appear. ???
I've looked into this and found that this "Refunds" button and record may not currently work.
I created a stuck in demo.sve and generated many refunds. You can check it here (https://drive.google.com/open?id=111QhNjw8AjxCaa-TMrgCphojpTuakHrS).
However, no convoy displaying "Refunds" button anywhere.
James - I'm not sure if this is a bug, but if it's a bug please separate this post.
Title: Re: Viewing curve speed limits and calculating acceleration time/distance
Post by: jamespetts on January 16, 2020, 12:33:47 PM
Post by: jamespetts on January 16, 2020, 12:33:47 PM
Thank you for your work on this, and my apologies for not having had time to look into this hitherto - I have quite a long queue of things that I am slowly trying to get through as and when I have time.
Thank you for investigating the refunds issue. That does appear to be a bug on the face of it, although I have not had chance to look into that reproduction case at this stage.
One query is whether the acceleration button and refunds button conflict when the refunds button is displayed; perhaps you could look into that? That would be most helpful.
Title: Re: Viewing curve speed limits and calculating acceleration time/distance
Post by: Ranran(retired) on January 16, 2020, 01:55:32 PM
Post by: Ranran(retired) on January 16, 2020, 01:55:32 PM
Quote from: jamespetts on January 16, 2020, 12:33:47 PMThat does appear to be a bug on the face of itThe refunds button I mentioned above is about the convoy info dialog, but the refunds information also can be checked in the Line management dialog to see the total value of the convoy on the line.
However, refunds charts continue to show 0 on any line despite a large amount of refunds. I think this indicates that refunds may not be recorded correctly.
QuoteOne query is whether the acceleration button and refunds button conflict when the refunds button is displayed; perhaps you could look into that?After removing the refunds button-hiding code and testing, I get the following display:

Originally, this button is hidden when there is no refunds data, so there is a space here.
EDIT: No margin on the left side of chart buttons, now I fixed this.
Title: Re: Viewing curve speed limits and calculating acceleration time/distance
Post by: Matthew on January 18, 2020, 10:48:09 AM
Post by: Matthew on January 18, 2020, 10:48:09 AM
I tried to build Ranran's dig-the-acceleration-curve branch to test this new feature. It compiles and runs, but I can't see the Acceleration and Tractive Force buttons in the convoy window. Is this expected? I understand this is work-in-progress and maybe some parts are not on Github yet. 8)
Also, the convoy window had some new bad behaviour. If I followed a convoy and then moved the convoy window, then only the menu bar of the convoy window was visible. The other parts (data, charts, etc.) disappeared.
I can do full steps-to-reproduce for both points if you want.
P.S. The most likely reason for the problem is that I have made a mistake with Git or in Simutrans, of course!
Title: Re: Viewing curve speed limits and calculating acceleration time/distance
Post by: Ranran(retired) on January 19, 2020, 01:10:06 PM
Post by: Ranran(retired) on January 19, 2020, 01:10:06 PM
Oh sorry, I think I have fixed it. It's my mistake. :-[
Thanks for testing and reporting. :D
Thanks for testing and reporting. :D
Title: Re: Viewing curve speed limits and calculating acceleration time/distance
Post by: Matthew on January 19, 2020, 03:04:36 PM
Post by: Matthew on January 19, 2020, 03:04:36 PM
Quote from: Ranran on January 19, 2020, 01:10:06 PM
Oh sorry, I think I have fixed it. It's my mistake. :-[
Thanks for testing and reporting. :D
Thank you for replying so quickly! I tried compiling your dig-acceleration-curve-chart branch and testing it. But it crashed two times.
Steps to reproduce:
1. Open Simutrans-Extended and make a new map.
2. Build stables (horse depot) and two stops.
3. Open the stables and build a convoy between the stops.
4. Start the convoy and then open the convoy window.
With the normal version, it crashed here. I compiled a debug version and got a little further:
5. Click on 'Tractive Force'.
The debug version crashed here.
The simu.log file from the debug version is here (https://app.box.com/s/7j3e2j1c8e1tigdu7hvbqndnzz70eom6). The Linux terminal had an extra error message:
Code Select
*** stack smashing detected ***: <unknown> terminated
Aborted (core dumped)
I don't know where the core dump is placed. If it's helpful then I can upload it.
By the way I enjoy playing with the livery patch. :)
Title: Re: Viewing curve speed limits and calculating acceleration time/distance
Post by: Ranran(retired) on January 19, 2020, 04:32:58 PM
Post by: Ranran(retired) on January 19, 2020, 04:32:58 PM
I downloaded it from my repository and compiled it, but I couldn't reproduce the crash.

Do other self-built versions crash?
Do other self-built versions crash?
Title: Re: Viewing curve speed limits and calculating acceleration time/distance
Post by: Matthew on January 19, 2020, 07:42:55 PM
Post by: Matthew on January 19, 2020, 07:42:55 PM
Quote from: Ranran on January 19, 2020, 04:32:58 PM
I downloaded it from my repository and compiled it, but I couldn't reproduce the crash.
Ranran, thank you for the quick reply. I checked again that I was up to date with your dig-acceleration-curve-chart, changed back to the normal (not debug) config, deleted my /build folder, and recompiled. I still get a crash after the same steps to reproduce. I have tried pak128.Britain-Ex in 1750 with a post boy like your screenshot. I also tried pak128.Sweden-Ex, in case I had somehow corrupted my Britain-Ex. Every time I got a crash when I tried to open the convoy window.
The build number is #3919923.
QuoteDo other self-built versions crash?
This is a very good question. I am a newbie and it's very possible that I am making a mistake. Thank you for your patience.
Other self-built versions do not crash in this way, though. I compiled James' master branch up to last night (20-01-19 0500 GMT) and my build runs OK. My build had the same version number as last night's Bridgewater-Brunel build (#b4e7900). I am building with G++ on Linux. I have attached my config.default, in case there is a mistake or difference there (I added .txt so that the forum accepts it).
Title: Re: Viewing curve speed limits and calculating acceleration time/distance
Post by: Qayyum on January 20, 2020, 06:59:40 AM
Post by: Qayyum on January 20, 2020, 06:59:40 AM
Matthew: Try download this to your computer where you run your game.

Title: Re: Viewing curve speed limits and calculating acceleration time/distance
Post by: Ranran(retired) on January 20, 2020, 09:30:02 AM
Post by: Ranran(retired) on January 20, 2020, 09:30:02 AM
Matthew - Thank you for the report. Perhaps those files are useless for the cause of the crash in this case, but the information that it does not crash on other versions was a hint. So I came up with one of the possibilities and made a fix for it.
Well I guess it was caused by my lack of knowledge - my apology.
I suppose Bernd's acceleration chart code was originally coded to not be used under certain circumstances. So I've changed the code that would have to be skipped if it wasn't supported. (I removed it because I wanted to see the buried chart. :-[) So I fixed it.
If it's fixed correctly, you won't be able to use this chart instead of causing the crash in your build.
I don't know what OS, compiler, lack of libraries, what makes it unavailable on your computer because I am not familiar with it. I would be grateful if anyone could give advice on this matter.
Title: Re: Viewing curve speed limits and calculating acceleration time/distance
Post by: Mariculous on January 20, 2020, 02:42:22 PM
Post by: Mariculous on January 20, 2020, 02:42:22 PM
Quote from: Ranran on January 20, 2020, 09:30:02 AMI would be grateful if anyone could give advice on this matter.It will be easyer to have a look at it if you told us your observations. To be preciese: Where in the physics code do you expect it to crash?
Title: Re: Viewing curve speed limits and calculating acceleration time/distance
Post by: jamespetts on January 21, 2020, 12:30:30 AM
Post by: jamespetts on January 21, 2020, 12:30:30 AM
Ranran - thank you for your splendid work on this, and apologies for not having been able to look into this earlier. I have now had a chance to test this. I have not noticed any crashes when using this.
Ultimately, this is a useful feature well presented and it would be good to be able to incorporate this. However, there are one or two anomalies at present that need at least some further consideration.
First of all, the acceleration curve seems to be capped at the current way's speed limit, so, for aircraft on a taxiway, for instance, it gives acceleration only up to 32km/h: one has to wait until an aircraft is flying before one can see real acceleration. The same would presumably apply to a train in a depot with a low speed track.
Secondly, the curve seems to change over time for reasons that are not entirely clear, indicating a higher top speed as the vehicle accelerates. This may be an anomaly in the physics engine.
Thirdly, the tractive green rolling resistance (the translation texts should be altered from "running" to "rolling" resistance) is hard to understand and is almost always so small a number that the graph is unintelligible next to the much larger tractive effort figure.
Fourthly, "tractive force" should be renamed "tractive effort" for consistency with other uses.
Finally, for appearance, it would be preferable if the usually hidden refunds button could be moved to the right of the two always on acceleration/tractive effort buttons so as not to leave a gap in normal circumstances. This is a minor enough issue, however, that it can be left if the workload for this would be excessive.
Incidentally, do I recall correctly that you reported a bug relating to the refunds graph not appearing? If so, I should be grateful if you could start a separate thread for that with a reproduction case, or else I will never remember to try to fix it.
Thank you again for all your work on this: this is much appreciated, and apologies again for the delay in testing this.
Title: Re: Viewing curve speed limits and calculating acceleration time/distance
Post by: Mariculous on January 21, 2020, 12:58:42 AM
Post by: Mariculous on January 21, 2020, 12:58:42 AM
Quote from: jamespetts on January 21, 2020, 12:30:30 AMThirdly, the tractive green rolling resistance (the translation texts should be altered from "running" to "rolling" resistance) is hard to understand and is almost always so small a number that the graph is unintelligible next to the much larger tractive effort figure.The also quite common alternative to this would be subtracting the rolling resistance from the force, but to be honest I prefer the two different curves. This will clearly show when a quite fast vehicle is mostly restricted by air resistance rather than tractive force decrease.
In the end this may not be as important to at least most vehicles as I am not aware of any simuvehicle that has a streamlined version as an upgrade. However, maybe there are some.
Title: Re: Viewing curve speed limits and calculating acceleration time/distance
Post by: Ranran(retired) on January 21, 2020, 01:54:53 PM
Post by: Ranran(retired) on January 21, 2020, 01:54:53 PM
Thank you for testing despite being busy.
This includes the current status of convoy, ie the weight of the load, the friction it receives and the speed limits due to constraints(signal and ways etc.).
I think current loading weight of convoy is an item that needs to be considered. On the other hand, I don't think the effects of slope and speed limit of way and signal are necessary.
I suppose adding a process to eliminate them but include loading weight may be a more task.
During the calculation of calc_move(), I couldn't find out if the restriction of the trajectory (way and signal) had an effect. Perhaps it is necessary to change the value of convoy's adverse.speed, but I am afraid that doing this requires more knowledge and work.
Perhaps an easier solution would be to create a virtual empty convoy and display a graph of theoretical values together.
This may not be correct as an English expression, in which case it needs to be corrected to the appropriate word.
when there is no recording, but currently it does not seem to be recording properly.Therefore, it seems that refunds button is always hidden.
EDIT: The Refunds button was intended to appear only on convoys that do not belong to the line. I overlooked that fact.
On the other hand, if it belongs to the line, are there no refunds for lines? There is no refunds record in the line management window too.
Quote from: jamespetts on January 21, 2020, 12:30:30 AMFirst of all, the acceleration curve seems to be capped at the current way's speed limit, so, for aircraft on a taxiway, for instance, it gives acceleration only up to 32km/h: one has to wait until an aircraft is flying before one can see real acceleration. The same would presumably apply to a train in a depot with a low speed track.This code was written by Bernd, but from my point of view, I think that current convoy is running in virtual space by calc_move() and getting the calculation result.
This includes the current status of convoy, ie the weight of the load, the friction it receives and the speed limits due to constraints(signal and ways etc.).
I think current loading weight of convoy is an item that needs to be considered. On the other hand, I don't think the effects of slope and speed limit of way and signal are necessary.
I suppose adding a process to eliminate them but include loading weight may be a more task.
During the calculation of calc_move(), I couldn't find out if the restriction of the trajectory (way and signal) had an effect. Perhaps it is necessary to change the value of convoy's adverse.speed, but I am afraid that doing this requires more knowledge and work.
Perhaps an easier solution would be to create a virtual empty convoy and display a graph of theoretical values together.
QuoteSecondly, the curve seems to change over time for reasons that are not entirely clear, indicating a higher top speed as the vehicle accelerates. This may be an anomaly in the physics engine.I think it is influenced by slope.
QuoteThirdly, the tractive green rolling resistance (the translation texts should be altered from "running" to "rolling" resistance) is hard to understand and is almost always so small a number that the graph is unintelligible next to the much larger tractive effort figure.The green chart is the sum of rolling resistance and air resistance. Therefore, I translated the Japanese word "走行抵抗" directly and explained it as running resistance.
This may not be correct as an English expression, in which case it needs to be corrected to the appropriate word.
QuoteFourthly, "tractive force" should be renamed "tractive effort" for consistency with other uses.I'll do it. EDIT: This implementation is complete.
Finally, for appearance, it would be preferable if the usually hidden refunds button could be moved to the right of the two always on acceleration/tractive effort buttons so as not to leave a gap in normal circumstances.
QuoteIncidentally, do I recall correctly that you reported a bug relating to the refunds graph not appearing? If so, I should be grateful if you could start a separate thread for that with a reproduction case, or else I will never remember to try to fix it.Please split reply # 51 into a new thread. The Refunds button is hidden
EDIT: The Refunds button was intended to appear only on convoys that do not belong to the line. I overlooked that fact.
On the other hand, if it belongs to the line, are there no refunds for lines? There is no refunds record in the line management window too.
Quote from: Freahk on January 21, 2020, 12:58:42 AMI prefer the two different curves.I agree. Although some examples picture are shown above, vehicles above 100 km/h can see some effect of air resistance, and even if the value is close to 0, the player can know the fact that its effect is not concerned about.
Title: Re: Viewing curve speed limits and calculating acceleration time/distance
Post by: Matthew on January 21, 2020, 01:55:23 PM
Post by: Matthew on January 21, 2020, 01:55:23 PM
Quote from: Ranran on January 20, 2020, 09:30:02 AM
Matthew - Thank you for the report. Perhaps those files are useless for the cause of the crash in this case, but the information that it does not crash on other versions was a hint. So I came up with one of the possibilities and made a fix for it.
Well I guess it was caused by my lack of knowledge - my apology.
No apology is needed! You have made a patch and have been very helpful in helping me to use it. Thank you!
QuoteI suppose Bernd's acceleration chart code was originally coded to not be used under certain circumstances. So I've changed the code that would have to be skipped if it wasn't supported. (I removed it because I wanted to see the buried chart. :-[) So I fixed it.
If it's fixed correctly, you won't be able to use this chart instead of causing the crash in your build.
I can see that you have used ifdef to try to avoid the problem. This is a very good idea. Unfortunately, the problem remains. When I open the convoy window, I get a crash. However, I now get a debug message in the terminal: :)
Build #f33ad74 (today's dig-acceleration-curve-chart branch)
Code Select
Debug: convoi::dump():
vehicle_count = 4
wait_lock = 0
owner_n = 0
akt_speed = 153
sp_soll = 1704
state = 6
statename = DRIVING
alte_direction = 0
jahresgewinn = 0
name = '(1) Friesian horses (pair)'
line_id = '0'
schedule = '0x5572b4b89920'
Segmentation fault (core dumped)
Not very helpful. ??? But that enabled me to find this in an old crash log:
Build #3919923 (dig-acceleration-curve-chart branch on 19 January in debug version)
Code Select
Debug: convoi::dump():
vehicle_count = 2
wait_lock = 0
owner_n = 0
akt_speed = 153
sp_soll = 114
state = 6
statename = DRIVING
alte_direction = 0
jahresgewinn = 0
name = '(1) Friesian horses (pair)'
line_id = '0'
schedule = '0x55612655fcd0'
Message: gui_textarea_t::recalc_size():	reset size to 11,0
Message: event:	0,-16
This might not be related to the crash (it was not the last message in the log). But it is maybe related. Unfortunately, gui_textarea_t::recalc_size() is deep inside the GUI code. There seem to be many calls between this method and your (Ranran's) patch. I think the next step is for me to carefully trace how this method is called in the patch. I think this is too difficult for me now because I am still learning C++. Maybe I will come back to this when I have more knowledge. But I should try some easier problems first.
QuoteI don't know what OS, compiler, lack of libraries, what makes it unavailable on your computer because I am not familiar with it. I would be grateful if anyone could give advice on this matter.
Quote from: jamespetts on January 21, 2020, 12:30:30 AMI have now had a chance to test this. I have not noticed any crashes when using this.
On this point: Ranran and James, are you both using Visual Studio Community on Windows to build this branch? And are you compiling #f33ad74, please? Maybe I am just making a silly mistake like building the wrong patch!
QuoteThirdly, the tractive green rolling resistance (the translation texts should be altered from "running" to "rolling" resistance) is hard to understand and is almost always so small a number that the graph is unintelligible next to the much larger tractive effort figure.
Fourthly, "tractive force" should be renamed "tractive effort" for consistency with other uses.
Ranran already started a thread about proof-reading (https://forum.simutrans.com/index.php?topic=19419.0). Shall we continue that discussion there?
QuoteThank you again for all your work on this: this is much appreciated
It is appreciated here too. I hope my problems don't distract you both from incorporating the patch into James' 'official' build.
Quote from: Qayyum on January 20, 2020, 06:59:40 AM
Matthew: Try download this to your computer where you run your game.
Thank you for your suggestion, Qayyum! As you said earlier, this feature would be a good way to determine how many wagons we can use.
Title: Re: Viewing curve speed limits and calculating acceleration time/distance
Post by: Ranran(retired) on January 22, 2020, 02:04:29 PM
Post by: Ranran(retired) on January 22, 2020, 02:04:29 PM
I found a interesting thread when Bernd Gabriel implemented the acceleration curve chart :)
https://forum.simutrans.com/index.php/topic,3657.msg35510.html#msg35510
https://forum.simutrans.com/index.php/topic,3657.msg35510.html#msg35510
Title: Re: Viewing curve speed limits and calculating acceleration time/distance
Post by: Ranran(retired) on January 30, 2020, 10:30:42 AM
Post by: Ranran(retired) on January 30, 2020, 10:30:42 AM
I may have fixed the cause of the crash on linux, so it would be helpful if you could check.
Also added a waytoll graph. It is important to note that save data from previous dig-acceleration-curve-chart branch versions will not be available with this change.
EDIT:
I have adjusted chart button colors.
checklist
- Confirmation of switching operation of each chart display of cost / acceleration / tractive effort
- Whether to cause a crash when building on Linux
- Check changed chart color, finance dialog, convoy dialog, line management dialog
- Check the contents of the tooltip added to the chart button
- Whether the display of the theoretical acceleration value is correct
TODO:
- Add waytoll chart to line managemanet dialog? (This affects the layout of the line management window)
Title: Re: Viewing curve speed limits and calculating acceleration time/distance
Post by: Matthew on January 30, 2020, 07:46:05 PM
Post by: Matthew on January 30, 2020, 07:46:05 PM
Quote from: Ranran on January 30, 2020, 10:30:42 AM
I may have fixed the cause of the crash on linux, so it would be helpful if you could check.
Thank you for your work on this, Ranran.
Unfortunately, I still get a crash at the same point : opening the convoy window, on a new map with Pak128.Britain-Ex. Here is the backtrace information from GDB:
Code Select
Debug: convoi::dump():
vehicle_count = 3
wait_lock = 0
owner_n = 0
akt_speed = 153
sp_soll = 3661
state = 6
statename = DRIVING
alte_direction = 4
jahresgewinn = 0
name = '(1) Hackney horses (pair)'
line_id = '0'
schedule = '0x5555561e4810'

Thread 1 "simutrans-exten" received signal SIGSEGV, Segmentation fault.
0x00005555556a3398 in button_t::init(button_t::type, char const*, scr_coord, scr_size) ()
(gdb) backtrace
#0  0x00005555556a3398 in button_t::init(button_t::type, char const*, scr_coord, scr_size) ()
#1  0x00005555556cfa95 in convoi_info_t::convoi_info_t(quickstone_tpl<convoi_t>) ()
#2  0x0000555555870df6 in convoi_t::show_info() ()
#3  0x00005555558f3a73 in tool_query_t::work(player_t*, koord3d) ()
#4  0x0000555555932693 in karte_t::call_work(tool_t*, player_t*, koord3d, bool&) ()
#5  0x00005555558c4457 in interaction_t::interactive_event(event_t const&) ()
#6  0x00005555558c4561 in interaction_t::process_event(event_t&) ()
#7  0x00005555558c4c1b in interaction_t::check_events() ()
#8  0x000055555594de54 in karte_t::interactive(unsigned int) ()
#9  0x00005555558d3864 in simu_main(int, char**) ()
#10 0x00005555558e93f2 in sysmain(int, char**) ()
#11 0x00007ffff6748b97 in __libc_start_main (main=0x5555555aaab0 <main>,
    argc=5, argv=0x7fffffffdfd8, init=<optimised out>, fini=<optimised out>,
    rtld_fini=<optimised out>, stack_end=0x7fffffffdfc8)
    at ../csu/libc-start.c:310
#12 0x00005555555aab1a in _start ()
Unfortunately, it seems to be a problem with buttons, your old enemy from the station window. :-[
Title: Re: Viewing curve speed limits and calculating acceleration time/distance
Post by: Ranran(retired) on January 30, 2020, 09:04:25 PM
Post by: Ranran(retired) on January 30, 2020, 09:04:25 PM
Matthew - Thank you for testing and sorry for wasting your time.
I suppose I have identified the cause and fix. Check it out when you have time and it will help.
I suppose I have identified the cause and fix. Check it out when you have time and it will help.
Title: Re: Viewing curve speed limits and calculating acceleration time/distance
Post by: Matthew on January 30, 2020, 11:15:30 PM
Post by: Matthew on January 30, 2020, 11:15:30 PM
Quote from: Ranran on January 30, 2020, 09:04:25 PM
Matthew - Thank you for testing and sorry for wasting your time.
You are only wasting my time because you are increasing that chance that I enjoy Simutrans more and play more! Is playing Simutrans wasting time??? Actually, I am worried that I am wasting your time, because it's very possible that these crashes are caused by a mistake on my part. I am still new. Maybe I am doing something wrong.
QuoteI suppose I have identified the cause and fix. Check it out when you have time and it will help.
Thank you for trying again. That fix does not seem to have been successful, but we have some more data. Running a build including #c955a9f04, I still get a crash at the same point. Here is the simu.log:
Code Select
Debug: interaction_t::process_event:	calling interactive_event
Message: interaction_t::interactive_event(event_t &ev):	calling a tool
Message: tool_query_t():	checking map square 156,17,0
Message: tool_query_t():	index 2
Debug: convoi::dump():
vehicle_count = 3
wait_lock = 0
owner_n = 0
akt_speed = 153
sp_soll = 1072
state = 6
statename = DRIVING
alte_direction = 2
jahresgewinn = 0
name = '(1) Hackney horses (pair)'
line_id = '0'
schedule = '0x555570eb4400'
Message: gui_textarea_t::recalc_size():	reset size to 11,0
And the GDB backtrace:
Code Select
Message: gui_textarea_t::recalc_size():	reset size to 11,0

Thread 1 "simutrans-exten" received signal SIGSEGV, Segmentation fault.
0x00005555556bd2b3 in button_t::set_typ (this=0x5555579fbe38, t=button_t::box_state) at gui/components/gui_button.cc:127
127				set_size( scr_size(gui_theme_t::gui_button_size.w, max(D_BUTTON_HEIGHT,LINESPACE)) );
(gdb) backtrace
#0  0x00005555556bd2b3 in button_t::set_typ (this=0x5555579fbe38, t=button_t::box_state) at gui/components/gui_button.cc:127
#1  0x00005555556bcf5e in button_t::init (this=0x5555579fbe38, type_par=button_t::box_state,
    text_par=0x555555a2c720 "Sends the convoi to the last depot it departed from!", pos_par=..., size_par=...)
    at gui/components/gui_button.cc:74
#2  0x00005555556e79b5 in convoi_info_t::convoi_info_t(quickstone_tpl<convoi_t>) ()
#3  0x00005555558bb4c6 in convoi_t::show_info() ()
#4  0x00005555559c5a41 in vehicle_t::show_info (this=0x5555a5463220) at vehicle/simvehicle.cc:2962
#5  0x000055555593d436 in tool_query_t::work (this=0x55555793eea0, player=0x555598aaafc0, pos=...) at simtool.cc:384
#6  0x000055555599668a in karte_t::call_work (this=0x55555a38a580, tool=0x55555793eea0, player=0x555598aaafc0, pos=...,
    suspended=@0x7fffffffb27a: false) at simworld.cc:10155
#7  0x0000555555918785 in interaction_t::interactive_event (this=0x55557fc5bf40, ev=...) at siminteraction.cc:240
#8  0x000055555591918a in interaction_t::process_event (this=0x55557fc5bf40, ev=...) at siminteraction.cc:417
#9  0x00005555559192b1 in interaction_t::check_events (this=0x55557fc5bf40) at siminteraction.cc:439
#10 0x0000555555997eab in karte_t::interactive (this=0x55555a38a580, quit_month=2147483647) at simworld.cc:10464
#11 0x0000555555926d88 in simu_main (argc=5, argv=0x7fffffffdfd8) at simmain.cc:1382
#12 0x000055555593aebc in sysmain (argc=5, argv=0x7fffffffdfd8) at simsys.cc:825
#13 0x0000555555a14f32 in main (argc=5, argv=0x7fffffffdfd8) at simsys_s2.cc:792
Earlier, I ran the debug build of the previous version (not including #c955a9f04) in GDB. It is more successful. I can open the convoy window! :) I can also see the lovely new acceleration chart. However, I get a crash when I open the tractive effort chart. The terminal report is this:
Code Select
Debug: main_view_t::display:	starting ...
Debug: main_view_t::display:	display pointer
*** stack smashing detected ***: <unknown> terminated

Thread 1 "simutrans-exten" received signal SIGABRT, Aborted.
__GI_raise (sig=sig@entry=6) at ../sysdeps/unix/sysv/linux/raise.c:51
51	../sysdeps/unix/sysv/linux/raise.c: No such file or directory.
Here is the backtrace for another crash with that debug build:
Code Select
Message: interaction_t::interactive_event(event_t &ev):	calling a tool
Message: tool_query_t():	checking map square 79,173,0
Message: tool_query_t():	index 3
Message: gui_textarea_t::recalc_size():	reset size to 11,0
Message: event:	0,-16
Message: gui_textarea_t::recalc_size():	reset size to 146,11
*** stack smashing detected ***: <unknown> terminated

Thread 1 "simutrans-exten" received signal SIGABRT, Aborted.
__GI_raise (sig=sig@entry=6) at ../sysdeps/unix/sysv/linux/raise.c:51
51	../sysdeps/unix/sysv/linux/raise.c: No such file or directory.
(gdb) backtrace
#0  __GI_raise (sig=sig@entry=6) at ../sysdeps/unix/sysv/linux/raise.c:51
#1  0x00007ffff6767801 in __GI_abort () at abort.c:79
#2  0x00007ffff67b0897 in __libc_message (action=action@entry=do_abort, fmt=fmt@entry=0x7ffff68dd988 "*** %s ***: %s terminated\n")
    at ../sysdeps/posix/libc_fatal.c:181
#3  0x00007ffff685bcd1 in __GI___fortify_fail_abort (need_backtrace=need_backtrace@entry=false,
    msg=msg@entry=0x7ffff68dd966 "stack smashing detected") at fortify_fail.c:33
#4  0x00007ffff685bc92 in __stack_chk_fail () at stack_chk_fail.c:29
#5  0x00005555559b98df in number_to_string (p=0x7fffffffacf6 "", f=0, decimals=180) at utils/simstring.cc:208
#6  0x3030303030303030 in ?? ()
#7  0x3030303030303030 in ?? ()
#8  0x3030303030303030 in ?? ()
#9  0x0000303030303030 in ?? ()
#10 0x0000000100426284 in ?? ()
#11 0x0235023b0243e500 in ?? ()
#12 0x40f4e5e15569000e in ?? ()
#13 0xffffffff0000023b in ?? ()
#14 0xffffffff00000019 in ?? ()
#15 0x0000025000000000 in ?? ()
#16 0x0000004e00000000 in ?? ()
#17 0x0000000000000064 in ?? ()
#18 0x00005555a4a1a308 in ?? ()
#19 0x0000000000000000 in ?? ()
Hopefully I will be able to test the debug build of the new commit at the weekend.
Title: Re: Viewing curve speed limits and calculating acceleration time/distance
Post by: Ranran(retired) on January 31, 2020, 11:33:30 AM
Post by: Ranran(retired) on January 31, 2020, 11:33:30 AM
Matthew - Thank you for testing. The part related to the button appears to have a problem, but currently has no idea...
I have added a theoretical high to the acceleration chart. This represents an acceleration graph with no load and unaffected by speed limits and slopes.


I changed the "Access charges" chart button to violet because orange has some of duplication.
In the finance dialogue, the expression "Access charges" is used. Is the expression "Access charge" correct in the convoy info dialog?
As you can see in the image above, "Access charges" is caught by the character limit, but I think "Access charge" will fit.
Finance originally modified Road toll with translation files. Does it change "Way toll" to "Access charge" via tab file in that case?
I have added a theoretical high to the acceleration chart. This represents an acceleration graph with no load and unaffected by speed limits and slopes.
I changed the "Access charges" chart button to violet because orange has some of duplication.
In the finance dialogue, the expression "Access charges" is used. Is the expression "Access charge" correct in the convoy info dialog?
As you can see in the image above, "Access charges" is caught by the character limit, but I think "Access charge" will fit.
Finance originally modified Road toll with translation files. Does it change "Way toll" to "Access charge" via tab file in that case?
Title: Re: Viewing curve speed limits and calculating acceleration time/distance
Post by: Mariculous on January 31, 2020, 12:29:21 PM
Post by: Mariculous on January 31, 2020, 12:29:21 PM
Quote from: Ranran on January 31, 2020, 11:33:30 AMI have added a theoretical high to the acceleration chart. This represents an acceleration graph with no load and unaffected by speed limits and slopes.That's awesome, however imho the theoretical max load acceleration rather than min load is the most important figure for comparisation.
Quote from: Ranran on January 31, 2020, 11:33:30 AMI changed the "Access charges" chart button to violet because orange has some of duplication.Maybe we should use the same color for any stat of the same "type", i.e. ones that can technically be displayed at the same time and where it makes sense to do so.
I guess the same principle is currently already used for the minimap options.
In this case it would be some thing like (discussable):
Total Capacity, Transported
Average Speed
Comfort
Revenue, Running Costs, Profit, Access charges
Distance
Acceleration
Tractive Effort
Title: Re: Viewing curve speed limits and calculating acceleration time/distance
Post by: Ranran(retired) on January 31, 2020, 12:58:00 PM
Post by: Ranran(retired) on January 31, 2020, 12:58:00 PM
Quote from: Freahk on January 31, 2020, 12:29:21 PMhowever imho the theoretical max load acceleration rather than min load is the most important figure for comparisation.I agree, it's make sense. I would change that way.
Quote from: Freahk on January 31, 2020, 12:29:21 PMIn this case it would be some thing like (discussable):I changed the color of some charts in this way when I changed the station chart. However, multiple charts are complicatedly involved, and it is troublesome to avoid conflicts. This time, I think the same can be said for convoy and finance. The finance window has many red-based colors. Which color do you think you should change?
Total Capacity, Transported
Average Speed
Comfort
Revenue, Running Costs, Profit, Access charges
Distance
Acceleration
Tractive Effort
Title: Re: Viewing curve speed limits and calculating acceleration time/distance
Post by: Mariculous on January 31, 2020, 01:20:59 PM
Post by: Mariculous on January 31, 2020, 01:20:59 PM
Indeed the color is important to the graph in a different way than it is to the minimap, so we may want to set a border color to any selected button that has the same color as the curve in the graph, whilst the main color of the buttons is the same for any button of the same group of compatible informations.
e.g. main colors
Total Capacity, Transported: Orange
Revenue, Running Costs, Profit, Access charges: Blue
Average Speed, Comfort, Distance, Acceleration, Tractive Effort: unique colors or all grey
Borders (on selection):
Revenue: Green
Running Costs: Red
Profit: Blue
Access charges: Orange
Any other border color can remain the same as the main color as it's unique anyways.
In any event, Buttons should be properly ordered by their type of information, so we should swap the position of "Distance" and "Access charges" and move the "average speed" closer to "Acceleration" and "Tractive effort", as these three are whilst technically incompatible still more or less related.
So I would suggest the following order:
Revenue, Running Costs, Profit, Access charges,
Total Capacity, Transported, Distance, Comfort,
Acceleration, Tractive Effort, Average Speed
I know the number of buttons per line is size dependant but I guess allignung the same type of information to the same line in default window scale is not a bad thing.
Title: Re: Viewing curve speed limits and calculating acceleration time/distance
Post by: Ranran(retired) on January 31, 2020, 01:37:53 PM
Post by: Ranran(retired) on January 31, 2020, 01:37:53 PM
I agree that similar kind information should be adjacent and more important information should be placed ahead. I was thinking a little about it.
Basically, the button layout code is from standard, which is arranged in numerical order of the record. To change this,
(1) Specify and place each one
(2) Create and assign an array that registered the location of each button
(3) Replace data when reading from old save depending on save version
Perhaps (2) is wise?
About color uniformity,
Does it make sense to swap the colors of "Cash flow" and "Operating profit" in the Finance window?
That is, match the color of "profit" in the convoy info dialog.
Title: Re: Viewing curve speed limits and calculating acceleration time/distance
Post by: Mariculous on January 31, 2020, 01:52:30 PM
Post by: Mariculous on January 31, 2020, 01:52:30 PM
Quote from: Ranran on January 31, 2020, 01:37:53 PMPerhaps (2) is wise?A mapping is quite straight forward, simple, efficient and does not break compatibility, so i guess yes, that is wise.
Quote from: Ranran on January 31, 2020, 01:37:53 PMAbout color uniformity,Absolutely! The same type of data should have the same color in any aspect where it is listed, thus e.g. Operating Profit should have the same color in vehicle window, line window and finance window (and any further if I forgot one)
Does it make sense to swap the colors of "Cash flow" and "Operating profit" in the Finance window?
That is, match the color of "profit" in the convoy info dialog.
Title: [patch] Revival of Physics curve chart
Post by: Ranran(retired) on July 27, 2020, 10:42:28 AM
Post by: Ranran(retired) on July 27, 2020, 10:42:28 AM
I wondered if some work would be needed for this repair work, but it was completed soon. So finally I post it. (Pull request #223 (https://github.com/Ranran-the-JuicyPork/simutrans-extended/tree/accel-curve-chart))
This patch was frozen because I was unable to address a crashing issue on linux last time.
But then, with the clue as to the problem caused by another patch, it turned out that it was most likely caused by the tooltip character limit.
I just fixed it and resolved the conflict with the master branch. (Please note that those tooltips were added by this patch and were not originally there. And I recommend that you revise the help text to explain this to players.)
I would appreciate if someone could check this on linux to see if it caused a crash.
Adieu (´・ω・`)
Title: Re: Viewing curve speed limits and calculating acceleration time/distance
Post by: jamespetts on July 29, 2020, 01:51:13 PM
Post by: jamespetts on July 29, 2020, 01:51:13 PM
Thank you for this.
I have now had an opportunity to test this a little further. I notice one anomaly at this stage: I am not sure how easy that it is to fix. This relates to the tractive effort graph: both numbers (the tractive effort and rolling resistance) seem to reduce to zero when the vehicle reaches its maximum speed. However, the x axis on the graph is not truncated to this point, but shows a large amount of useless data to the right of this point. One particularly bad example is convoy no. 22 on demo.sve, where about a quarter of the graph is occupied with zero data. Ideally, the graph would end at the highest speed attainable and before the values drop to zero. In the current state, it is very difficult to read the resistance graph, since the value on the right hand side is always given as zero, so that the only way to read any values on the graph is to mouse-over them.
Also, I notice that there are no tooltips for the buttons in the convoy window, but this is equally the case in the current master branch. Had it been intended to implement these?
Thank you again for your work on this.
Title: Re: Viewing curve speed limits and calculating acceleration time/distance
Post by: Ranran(retired) on August 02, 2020, 02:58:06 PM
Post by: Ranran(retired) on August 02, 2020, 02:58:06 PM
QuoteI am not sure how easy that it is to fix.I'm worried that the code for it creates some complexity, as it hacks and displays an existing chart code.
QuoteIdeally, the graph would end at the highest speed attainable and before the values drop to zero.I made that change.
QuoteAlso, I notice that there are no tooltips for the buttons in the convoy window, but this is equally the case in the current master branch. Had it been intended to implement these?Yes, I tried to add it while I was making this patch before. But I made the array size too small. I think that was the cause of the crash on Linux.
I didn't add it this time because it didn't originally exist. If it doesn't crash in Linux, it's clear that it was the cause.
Title: Re: Viewing curve speed limits and calculating acceleration time/distance
Post by: Mariculous on August 02, 2020, 03:25:37 PM
Post by: Mariculous on August 02, 2020, 03:25:37 PM
Quote from: Ranran on August 02, 2020, 02:58:06 PMI think that was the cause of the crash on Linux.lalala std::array is nice, we all should like the stdlib.
Title: Re: Viewing curve speed limits and calculating acceleration time/distance
Post by: jamespetts on August 02, 2020, 07:40:22 PM
Post by: jamespetts on August 02, 2020, 07:40:22 PM
Quote from: Freahk on August 02, 2020, 03:25:37 PM
lalala std::array is nice, we all should like the stdlib.
The problem with the std collection classes is that they are often slower than the Simutrans equivalents (this is definitely true of the hashtable), and this can make a big difference to performance whenever they are used in performance critical parts of the code.
The Simutrans vector_tpl is sufficient for most cases where an array is needed.
Title: Re: Viewing curve speed limits and calculating acceleration time/distance
Post by: Mariculous on August 03, 2020, 09:20:45 AM
Post by: Mariculous on August 03, 2020, 09:20:45 AM
This is definitely not true for std::array. It is equally fast as plain C arrays, though the operator[] doesn't do boundary checks by default for performance reasons.
It can however be compiled to do these checks, which plain arrays (e.g. something like int[256]) cannot do on its own.
Whenevever an array is needed, you don't want to use vector_tpl, as it's not an array but a vector.
The standard equivalent to vector_tpl is simply called std::vector and it's pretty fast either. I would not expect any performance penalty compared to vector_tpl here either.
About std::map, it's still much more complicated here. In the first place, std::map is not the equivalent of hashtable_tpl, because std::map is ordered, hashtable_tpl is not (within a single bucket it is, but generally it's not.)
The actual equivalent is std::unordered_map, which is usually roughly 3-times faster than std::map, though it cannot be said that generally either.
On top of this, you definitely can not even generally say "simutrans implementation is definitely faster than the standard one"
Hashtables are always a tradeoff in between memory consumption and performance.
Simutrans implementation makes use of a fixed size of 101 buckets, which semselves are linked lists.
So with a small number of elements, you will most likely never iterate any of these lists. The has will tell you in which bucket you can find the data and the data will most often be the very first element of the list.
Though, even if there is only a single element stored in the hashtable, there will be 101 lists, of which 100 are empty and one contains exactly on element. This waste of memory is obviously very fast when it comes to any kind of operation.
On the other hand, if you insert 101 million elments into a single simutrans hashtable, there will be on average 1 million elements per list, so your performance will be simmilar to accessing from or inserting to a 1 million element long linked list.
Even std::map will be much faster here, not to mention std::unordered_map will be even faster.
Title: Re: Viewing curve speed limits and calculating acceleration time/distance
Post by: jamespetts on August 03, 2020, 11:23:41 AM
Post by: jamespetts on August 03, 2020, 11:23:41 AM
That is interesting, although I should note that my performance comparisons were with std::unordered_map, not std::map.
Title: Re: Viewing curve speed limits and calculating acceleration time/distance
Post by: jamespetts on August 03, 2020, 05:26:41 PM
Post by: jamespetts on August 03, 2020, 05:26:41 PM
Ranran - thank you for this. I have now had a chance to test the latest version. What I notice is that the graph is truncated but that the scale of the chart is not updated to match that truncation such that there is still a considerable amount of wasted space on the right of the chart. Would updating the scale of the chart dynamically so that the truncated lines end up on the far right of the chart no matter where the truncation takes place be challenging or is it something that can readily be achieved?
Thank you again for your work on this.
Thank you again for your work on this.
Title: Re: Viewing curve speed limits and calculating acceleration time/distance
Post by: Mariculous on August 03, 2020, 06:46:54 PM
Post by: Mariculous on August 03, 2020, 06:46:54 PM
I don't know. This was suggested before, but Ranran said it would be very difficult.
I assume the idea behind this was to have fixed speed steps in between two data points but a variable number of data points. I have no idea of the involved graphics code, so I can't say anything about this nor work out an idea to solve this.
The other way round might be easier. Have a fixed number of data points but variable speed steps in between these.
You could simply get the maximum speed and display data of every vMax/datapoints increment of speed.
I am quite sure I have seen something like this before in one of the graphs you presented.
Why was this replaced by the current figure with a lot of empty space?
If it was because of odd speed steps, like 225/24=9.375 km/h, this could be solved by rounding these steps up in 5 km/h steps or something, so at least there will be less wasted space.
Title: Re: Viewing curve speed limits and calculating acceleration time/distance
Post by: jamespetts on August 08, 2020, 10:40:53 AM
Post by: jamespetts on August 08, 2020, 10:40:53 AM
I notice that Ranran has pushed some changes that appear to be making progress towards truncating the graphs, but the trunction seems to be off by one so far. I shall be interested to learn of progress in relation to this.
Title: Re: Viewing curve speed limits and calculating acceleration time/distance
Post by: Ranran(retired) on August 08, 2020, 12:21:25 PM
Post by: Ranran(retired) on August 08, 2020, 12:21:25 PM
Label must be an integer. Otherwise it will be difficult to set the x-axis label and see the graph. So I set the proper axis and then quit the process.
As already mentioned, it hacks and displays existing systems like an overtaking patch, so it inserts a lot of code to resolve inconsistencies in order to be consistent with existing systems. I'm afraid that this will compromise readability and maintainability.
For example, it doesn't depend on this graph orientation option.
extended has a different orientation than standard from the default orientation of the graph.
So this means the graph of maximum speed on the left. It is the exact opposite of a general f-v/v-t graph.
If this is cut off in the middle, the label value and position and the drawing position of the graph must be adjusted.
If you want to fix this in the future, you need to be careful if the left_to_right_graphs option is changed and it still works.
That way many cat and mouse games are executed.
And unfortunate news. I made a mistake in the judgment formula that aborting the chart display last time. That is, the chart was aborted one step before the actual display.
EDIT:
There is currently a bug with incorrect x-axis labels. (One shift)
As already mentioned, it hacks and displays existing systems like an overtaking patch, so it inserts a lot of code to resolve inconsistencies in order to be consistent with existing systems. I'm afraid that this will compromise readability and maintainability.
For example, it doesn't depend on this graph orientation option.
extended has a different orientation than standard from the default orientation of the graph.
So this means the graph of maximum speed on the left. It is the exact opposite of a general f-v/v-t graph.
If this is cut off in the middle, the label value and position and the drawing position of the graph must be adjusted.
If you want to fix this in the future, you need to be careful if the left_to_right_graphs option is changed and it still works.
That way many cat and mouse games are executed.
QuoteI notice that Ranran has pushed some changesAnyway i implemented it. I apologize for the late report.
And unfortunate news. I made a mistake in the judgment formula that aborting the chart display last time. That is, the chart was aborted one step before the actual display.
Quotethe trunction seems to be off by one so far.Therefore, it is a correct specification that the chart should be 0 at the end. This is because the acceleration force of a vehicle with a maximum speed of 120 km/h returns 0 when the maximum speed is 120 km/h. That is the current physics code. If not, it will accelerate to 121 km/h.
EDIT:
There is currently a bug with incorrect x-axis labels. (One shift)
Title: Re: Viewing curve speed limits and calculating acceleration time/distance
Post by: freddyhayward on August 08, 2020, 12:42:22 PM
Post by: freddyhayward on August 08, 2020, 12:42:22 PM
This branch still crashes on linux due to the use of char *.
Title: Re: Viewing curve speed limits and calculating acceleration time/distance
Post by: Ranran(retired) on August 10, 2020, 10:28:55 AM
Post by: Ranran(retired) on August 10, 2020, 10:28:55 AM
Quote from: freddyhayward on August 08, 2020, 12:42:22 PMThis branch still crashes on linux due to the use of char *.Thank you for testing.
The only new char variable I added is the button label, so I wonder if it was because I didn't enclose the added macro replacement list in parentheses. If not, I can't think of any other cause... (´・ω・`)
Title: Re: Viewing curve speed limits and calculating acceleration time/distance
Post by: freddyhayward on August 10, 2020, 11:37:29 AM
Post by: freddyhayward on August 10, 2020, 11:37:29 AM
Quote from: Ranran on August 10, 2020, 10:28:55 AMI could not properly trace where the error originated, because the memory was corrupted by some kind of overflow. But it did show that it came from number_to_string().
Thank you for testing.
The only new char variable I added is the button label, so I wonder if it was because I didn't enclose the added macro replacement list in parentheses. If not, I can't think of any other cause... (´・ω・`)
EDIT: I tried with your latest commit, "align buffer size", but it still crashes,
Title: Re: Viewing curve speed limits and calculating acceleration time/distance
Post by: freddyhayward on August 12, 2020, 01:53:26 AM
Post by: freddyhayward on August 12, 2020, 01:53:26 AM
I found the cause of the crash - to calculate the precision of the curves, you used the lookup-table array that stores whether a given button index ought to display curves, and multiplied it by two. The intended outcome was 0 (false * 2), but instead accessed garbage data beyond the array's capacity, so the actual outcome was 180 digits after the decimal place, too large for the maximum size of 128 allowed by number_to_string. How was the button index and the lookup array capacity determined? I don't know, but it seemed to be some ancient ritual using macros. I can't blame you for following tradition - you did not introduce any bad code yourself, but relied on it. I think that this episode has provided a valuable lesson in what to avoid: avoid macros, avoid c-style arrays, and avoid c-style strings/buffers. The first two should be replaced by an enum containing the names of all the buttons and a function that maps each button index to the corresponding number of decimal places using a switch statement.
EDIT: The crash still occurs upon click on the convoy in release builds. Only the debug builds work.
Separately, I have a few issues with the current implementation of this feature.
1. I don't think that these graphs belong with the history charts - they use a different x-axis and cannot be overlaid with them. If you have 3 history curves enabled, but then enable the acceleration curve, the other 3 disappear. Disable the acceleration curve and the 3 curves are still missing, but the different x-axis from the acceleration curve remains.
2. The curve flaps up and down when the convoy is moving. This ought to be constant information.
3. it is unclear what the x-axis means.
4. it is unclear what the secondary line means, and it is impossible to see it clearly.
Title: Re: Viewing curve speed limits and calculating acceleration time/distance
Post by: Ranran(retired) on August 16, 2020, 04:21:09 PM
Post by: Ranran(retired) on August 16, 2020, 04:21:09 PM
Thank you very much for testing and elucidating the cause. That is very helpful.
I almost agree with freddyhayward's opinion, but after thinking about the solution, unfortunately this patch seems to have to be moved to the end of the long queue again. (´・ω・`)
Originally this patch was a fairly low priority for me. But I happened to find the Bernd Gabriel's chart in the code and thought I could implement it with a little effort, so I worked on it.
Originally there was only one graph and only 12 x-axes. I felt that the x-axis was missing, so I expanded it. Added more items.
I hacked and expanded the chart like that, but this was not a good technique. I think we should have separated the charts with tabs.
The tabbing of convoy info is done in standard, and standard has integrated the convoy detail tab into 1 dialog. But in my opinion, extended should not go the same way.
Convoy detail is already tabbed and has some tabs. In addition, it is necessary to tabbed features that are not in standard such as class manager and times history.
Tabbing them isn't a high priority due to their small benefits, and it's better to wait for the standard GUI overhaul to be incorporated. (At least for the moment, tabbing them seems like a lot of work.)
Macros will no longer be needed.
These are the reasons why this patch is postponed to a distant future. (´・ω・`)
I almost agree with freddyhayward's opinion, but after thinking about the solution, unfortunately this patch seems to have to be moved to the end of the long queue again. (´・ω・`)
Originally this patch was a fairly low priority for me. But I happened to find the Bernd Gabriel's chart in the code and thought I could implement it with a little effort, so I worked on it.
Quote1. I don't think that these graphs belong with the history charts - they use a different x-axis and cannot be overlaid with them. If you have 3 history curves enabled, but then enable the acceleration curve, the other 3 disappear. Disable the acceleration curve and the 3 curves are still missing, but the different x-axis from the acceleration curve remains.This was implemented here only because Bernd Gabriel made it here. (It may have been just for debugging purposes.) It's better to check in advance in the depot than to check it when convoy is running. Adding charts to the depot dialog also seems like a big task. The overhaul of the depot dialog may also be something to go with the addition of the overhaul feature or the re-combination feature. (Accompanied by changes in the replace dialog.)
Originally there was only one graph and only 12 x-axes. I felt that the x-axis was missing, so I expanded it. Added more items.
I hacked and expanded the chart like that, but this was not a good technique. I think we should have separated the charts with tabs.
The tabbing of convoy info is done in standard, and standard has integrated the convoy detail tab into 1 dialog. But in my opinion, extended should not go the same way.
Convoy detail is already tabbed and has some tabs. In addition, it is necessary to tabbed features that are not in standard such as class manager and times history.
Tabbing them isn't a high priority due to their small benefits, and it's better to wait for the standard GUI overhaul to be incorporated. (At least for the moment, tabbing them seems like a lot of work.)
Macros will no longer be needed.
Quote2. The curve flaps up and down when the convoy is moving. This ought to be constant information.This is almost exactly the specification made by Bernd Gabriel. It needs to change the design because it picks up the current data of convoy and needs to eliminate those effects. Some also wanted to know the current acceleration and acceleration time information.
Quote3. it is unclear what the x-axis means.I think standard has the function to add units but extended has not.
Quote4. it is unclear what the secondary line means, and it is impossible to see it clearly.Separating the buttons suggests that we should have three tabs for charts.
These are the reasons why this patch is postponed to a distant future. (´・ω・`)
Title: Re: Viewing curve speed limits and calculating acceleration time/distance
Post by: jamespetts on August 18, 2020, 10:58:40 PM
Post by: jamespetts on August 18, 2020, 10:58:40 PM
I think that, if the crash can be fixed, this patch in its current form is better than not having an acceleration graph even if it would be ideal to have the graphs in the depot one day.
Ranran - can I check whether the crash has been fixed? If so, I can re-test and consider any more minor amendments that may be needed.
Ranran - can I check whether the crash has been fixed? If so, I can re-test and consider any more minor amendments that may be needed.
Title: Re: Viewing curve speed limits and calculating acceleration time/distance
Post by: freddyhayward on August 19, 2020, 01:39:40 AM
Post by: freddyhayward on August 19, 2020, 01:39:40 AM
Quote from: jamespetts on August 18, 2020, 10:58:40 PMI should just note that these crashes tend to occur on Linux rather than Windows, so it must be tested on Linux (which I will gladly do) before merging.
I think that, if the crash can be fixed, this patch in its current form is better than not having an acceleration graph even if it would be ideal to have the graphs in the depot one day.
Ranran - can I check whether the crash has been fixed? If so, I can re-test and consider any more minor amendments that may be needed.
Title: Re: Viewing curve speed limits and calculating acceleration time/distance
Post by: jamespetts on August 19, 2020, 07:16:56 PM
Post by: jamespetts on August 19, 2020, 07:16:56 PM
Quote from: freddyhayward on August 19, 2020, 01:39:40 AM
I should just note that these crashes tend to occur on Linux rather than Windows, so it must be tested on Linux (which I will gladly do) before merging.
That is very helpful, thank you. If Ranran could let Freddy know when this is ready to be tested and if Freddy could let me know when he has tested, that would be very helpful.
Thank you both.
Title: Re: Viewing curve speed limits and calculating acceleration time/distance
Post by: jamespetts on August 25, 2020, 08:59:29 PM
Post by: jamespetts on August 25, 2020, 08:59:29 PM
I have seen some (possibly conflicting) activity on Github relating to this, but I do not think that I have seen any confirmation that this is ready; can I check what the status of this is to make sure that I am not missing this in error?
Title: Re: Viewing curve speed limits and calculating acceleration time/distance
Post by: Ranran(retired) on August 29, 2020, 02:18:43 AM
Post by: Ranran(retired) on August 29, 2020, 02:18:43 AM
Thank you for your opinion.
Unfortunately, I think the effort to make my patch sanity is huge and the outlook for the future is bleak. (´・ω・`)
I just tampered with the chart code by incorporating from the standard. It can't avoid conflicts with them, and requires more effort. It is useful in its own right as it includes the ability to display units on charts, and is also useful for accelerated charts. Rather, it's a necessary feature as pointed out by freddy. As such, the code in this patch needs a major overhaul as it needs to be redesigned.
I think others fixes that are relevant are probably those, but those fixes are welcome. Don't worry about the progress of this patch. ;)
Now I'm thinking it's better to wait for a GUI overhaul as recommended by Prissi and A.Carlotti. Because I feel it is relatively close. It can be a daunting task in itself, but it's definitely beneficial.
Unfortunately, I think the effort to make my patch sanity is huge and the outlook for the future is bleak. (´・ω・`)
I just tampered with the chart code by incorporating from the standard. It can't avoid conflicts with them, and requires more effort. It is useful in its own right as it includes the ability to display units on charts, and is also useful for accelerated charts. Rather, it's a necessary feature as pointed out by freddy. As such, the code in this patch needs a major overhaul as it needs to be redesigned.
Quote from: jamespetts on August 25, 2020, 08:59:29 PMI have seen some (possibly conflicting) activity on Github relating to thisI'm aware of a bug in the code on the master branch and I've fixed some with my unfinished patch. Many of the variables used for the maximum value of the chart's for statement are incorrect. (save and loading thing too)
I think others fixes that are relevant are probably those, but those fixes are welcome. Don't worry about the progress of this patch. ;)
Now I'm thinking it's better to wait for a GUI overhaul as recommended by Prissi and A.Carlotti. Because I feel it is relatively close. It can be a daunting task in itself, but it's definitely beneficial.
Title: Re: Viewing curve speed limits and calculating acceleration time/distance
Post by: jamespetts on August 29, 2020, 11:15:47 AM
Post by: jamespetts on August 29, 2020, 11:15:47 AM
Thank you for this - that is very helpful. I am sorry that you have to do so much work to redesign what was virtually finished and very useful.
In relation to a GUI overhaul, I should be interested in your views on how that should interact with the much delayed work on convoy recombination and vehicle maintenance; the UI on this has been started by Ves some time ago, I think, but I am not sure how much work has been done in relation to it.
At present, my priority needs to be to try to find the cause of the loss of synchronisation, so there will be some time before I can return to consider working on the balance critical features, in which time some consideration might be given to whether the GUI overhaul should be done first so that the GUI for this ends up being written with the new UI code.
Title: Re: Viewing curve speed limits and calculating acceleration time/distance
Post by: Ranran(retired) on August 29, 2020, 01:22:28 PM
Post by: Ranran(retired) on August 29, 2020, 01:22:28 PM
I think ceeac was working on restoring the acceleration chart. It should look something like this, as I introduced before.
There will be three changes in the GUI coding in the near future.
(1) r8134(120.2.2) - The color definition is extended from 8bit to 16bit.
Therefore, it is necessary to deal with the change of variables and functions. This is what I am working on now and is almost complete.Currently stumbling on reading the old save.
(2) r8434(120.3) - Support for truetype fonts and large fonts.
Players will be able to select their favorite font in settings. You can easily change the font from the setting dialog.
This will require revising the layout and variables.I'm now ready to start this incorporating work and I can start it anytime.
Now that the basic import is complete, I'll pick up the related commits.
(3) r8653 - GUI overhaul
This requires a rewrite of the all GUI code. Create a GUI to place components in tables and cells. This requires a lot of work and an extended-specific GUI can require a lot of work. This is why some people advised to wait until this stage for making a new GUI.
If you create a new GUI at the moment, that GUI will have to deal with all the conflicts for these three changes. (´・ω・`)
If we don't merge those from standards, we don't need to. But with phystam progressing it to some extent, I realized it was imminent.
So when it comes to the GUI, I thought I could speed it up, so I decided to go ahead with it rather than make new changes.
If Ves or someone else doesn't handle the three changes, creating a GUI after the introduction of the overhaul will save you a lot of work.
Quote from: Ranran on January 06, 2020, 06:02:29 AMIt was something like this. 8)
Quote from: jamespetts on August 29, 2020, 11:15:47 AMIn relation to a GUI overhaul, I should be interested in your views on how that should interact with the much delayed work on convoy recombination and vehicle maintenance; the UI on this has been started by Ves some time ago, I think, but I am not sure how much work has been done in relation to it.I'm currently focusing on commits related to GUI and drawing. Because I'm looking at the GUI code to some extent, conflict resolution doesn't take much time. In addition, it is unlikely that incorporating about the GUI will affect desync, so I think it will not be so far to proceed to just before the GUI overhaul.
There will be three changes in the GUI coding in the near future.
(1) r8134(120.2.2) - The color definition is extended from 8bit to 16bit.
Therefore, it is necessary to deal with the change of variables and functions. This is what I am working on now and is almost complete.
(2) r8434(120.3) - Support for truetype fonts and large fonts.
Players will be able to select their favorite font in settings. You can easily change the font from the setting dialog.
This will require revising the layout and variables.
Now that the basic import is complete, I'll pick up the related commits.
(3) r8653 - GUI overhaul
This requires a rewrite of the all GUI code. Create a GUI to place components in tables and cells. This requires a lot of work and an extended-specific GUI can require a lot of work. This is why some people advised to wait until this stage for making a new GUI.
If you create a new GUI at the moment, that GUI will have to deal with all the conflicts for these three changes. (´・ω・`)
If we don't merge those from standards, we don't need to. But with phystam progressing it to some extent, I realized it was imminent.
So when it comes to the GUI, I thought I could speed it up, so I decided to go ahead with it rather than make new changes.
If Ves or someone else doesn't handle the three changes, creating a GUI after the introduction of the overhaul will save you a lot of work.
Title: Re: Viewing curve speed limits and calculating acceleration time/distance
Post by: jamespetts on August 29, 2020, 02:08:58 PM
Post by: jamespetts on August 29, 2020, 02:08:58 PM
This is extremely helpful - thank you for all your excellent work on this. I will hopefully have a chance to test progress so far once the loss of synchronisation issue has been fixed.
Title: Re: Viewing curve speed limits and calculating acceleration time/distance
Post by: Ranran(retired) on November 01, 2020, 05:13:28 AM
Post by: Ranran(retired) on November 01, 2020, 05:13:28 AM
I ported the accel chart to convoy detail so that I can see the accel chart from the depot as reported in another thread.
However, it is currently not possible to open it from the depot. (However, it has been changed so that the dialog does not close when entering the depot.)
It would be helpful at this stage to see if it would cause a crash on linux as before.
The branch is accel-curve-chart-v2 (https://github.com/Ranran-the-JuicyPork/simutrans-extended/tree/accel-curve-chart-v2).
Acceleration and force information has been separated into separate tabs based on freddy's suggestions.
Title: Re: Viewing curve speed limits and calculating acceleration time/distance
Post by: freddyhayward on November 01, 2020, 01:57:27 PM
Post by: freddyhayward on November 01, 2020, 01:57:27 PM
Quote from: Ranran on November 01, 2020, 05:13:28 AMIt would be helpful at this stage to see if it would cause a crash on linux as before.I cannot compile that branch. When I try to checkout, it deletes cmakelists.txt and breaks my IDE. I can't remember what the error was, something with type_traits and static_assert. I can't try it again because I don't want to break my configuration again. According to github there are over 700 commits in that branch - it can't have been a good idea to expand the branch with additional changes and features when the most important feature is broken.
Title: Re: Viewing curve speed limits and calculating acceleration time/distance
Post by: jamespetts on November 01, 2020, 02:11:09 PM
Post by: jamespetts on November 01, 2020, 02:11:09 PM
Can I check whether this branch is intended to work alongside the master branch or one of the merge from Standard branches?
Title: Re: Viewing curve speed limits and calculating acceleration time/distance
Post by: freddyhayward on November 01, 2020, 02:16:20 PM
Post by: freddyhayward on November 01, 2020, 02:16:20 PM
Quote from: jamespetts on November 01, 2020, 02:11:09 PMI understand this is addressed to ranran, but I should add that the other merge-from-standard branches that I have tested are able to compile and run successfully.
Can I check whether this branch is intended to work alongside the master branch or one of the merge from Standard branches?
Title: Re: Viewing curve speed limits and calculating acceleration time/distance
Post by: Spenk009 on November 01, 2020, 02:17:46 PM
Post by: Spenk009 on November 01, 2020, 02:17:46 PM
It works very well on my Ubuntu machine, compiled from the suggested branch and run on a fresh copy of PakBritain-Ex (compiled without issues):

Would it make sense to show speed reached in lower increments if vmax is not shown on the graph? Example: The lower two graphs are from a GWR 3700 Class that can reach up to 150km/h, would it be helpful to show at least twice or quadruple the distance in "v-t graph"?
OS: Ubuntu 20.04.1 LTS x86_64
Host: 20EFS01B01 ThinkPad W541
Kernel: 5.4.0-52-generic
Uptime: 4 days, 23 hours, 3 mins
Packages: 2716 (dpkg), 6 (snap)
Shell: bash 5.0.17
Resolution: 2880x1620
DE: Plasma
WM: KWin
Theme: Breeze [Plasma], Breeze [GTK2/3]
Icons: breeze [Plasma], breeze [GTK2/3]
Terminal: konsole
CPU: Intel i7-4810MQ (8) @ 3.800GHz
GPU: NVIDIA Quadro K2100M
GPU: Intel 4th Gen Core Processor
Memory: 9147MiB / 17686MiB
Title: Re: Viewing curve speed limits and calculating acceleration time/distance
Post by: Ranran(retired) on November 01, 2020, 02:19:35 PM
Post by: Ranran(retired) on November 01, 2020, 02:19:35 PM
I'm sorry. This is a derivative of the r8653 branch, but I haven't merged the changes in r8653 branch yet.
Title: Re: Viewing curve speed limits and calculating acceleration time/distance
Post by: freddyhayward on November 01, 2020, 02:22:42 PM
Post by: freddyhayward on November 01, 2020, 02:22:42 PM
This is the error:
Code Select
In file included from /usr/include/c++/10/bits/stl_iterator_base_types.h:67,
                 from /usr/include/c++/10/iterator:61,
                 from bauer/../utils/../utils/for.h:10,
                 from bauer/../utils/../simtypes.h:13,
                 from bauer/../utils/log.h:12,
                 from bauer/../simdebug.h:21,
                 from bauer/brueckenbauer.cc:8:
/usr/include/c++/10/type_traits: In instantiation of 'struct std::is_move_constructible<sparse_tpl<short unsigned int> >':
/usr/include/c++/10/type_traits:138:12:   required from 'struct std::__and_<std::is_move_constructible<sparse_tpl<short unsigned int> >, std::is_move_assignable<sparse_tpl<short unsigned int> > >'
/usr/include/c++/10/type_traits:143:12:   required from 'struct std::__and_<std::__not_<std::__is_tuple_like<sparse_tpl<short unsigned int> > >, std::is_move_constructible<sparse_tpl<short unsigned int> >, std::is_move_assignable<sparse_tpl<short unsigned int> > >'
/usr/include/c++/10/type_traits:2195:11:   required by substitution of 'template<class ... _Cond> using _Require = std::__enable_if_t<std::__and_< <template-parameter-1-1> >::value> [with _Cond = {std::__not_<std::__is_tuple_like<sparse_tpl<short unsigned int> > >, std::is_move_constructible<sparse_tpl<short unsigned int> >, std::is_move_assignable<sparse_tpl<short unsigned int> >}]'
/usr/include/c++/10/bits/move.h:189:5:   required by substitution of 'template<class _Tp> std::_Require<std::__not_<std::__is_tuple_like<_Tp> >, std::is_move_constructible<_Tp>, std::is_move_assignable<_Tp> > std::swap(_Tp&, _Tp&) [with _Tp = sparse_tpl<short unsigned int>]'
bauer/../obj/../tpl/sparse_tpl.h:242:15:   required from 'class sparse_tpl<short unsigned int>'
bauer/../obj/../simcity.h:171:21:   required from here
/usr/include/c++/10/type_traits:960:52: error: static assertion failed: template argument must be a complete class or an unbounded array
  960 |       static_assert(std::__is_complete_or_unbounded(__type_identity<_Tp>{}),
Title: Re: Viewing curve speed limits and calculating acceleration time/distance
Post by: jamespetts on November 01, 2020, 02:45:46 PM
Post by: jamespetts on November 01, 2020, 02:45:46 PM
Quote from: Ranran on November 01, 2020, 02:19:35 PM
I'm sorry. This is a derivative of the r8653 branch, but I haven't merged the changes in r8653 branch yet.
Excellent, thank you: please let me know when you have merged these changes so that I can start work in testing this.
Title: Re: Viewing curve speed limits and calculating acceleration time/distance
Post by: Ranran(retired) on November 01, 2020, 03:20:59 PM
Post by: Ranran(retired) on November 01, 2020, 03:20:59 PM
accel-curve-chart-v2 branch is now up to date.
Title: Re: Viewing curve speed limits and calculating acceleration time/distance
Post by: freddyhayward on November 01, 2020, 09:22:52 PM
Post by: freddyhayward on November 01, 2020, 09:22:52 PM
Quote from: Ranran on November 01, 2020, 03:20:59 PMIt compiles, runs, doesn't crash, and its new location in the tabs make sense! Thank you!
accel-curve-chart-v2 branch is now up to date.
Title: Re: Viewing curve speed limits and calculating acceleration time/distance
Post by: Ranran(retired) on November 02, 2020, 11:27:16 AM
Post by: Ranran(retired) on November 02, 2020, 11:27:16 AM
Thank you for your confirmation. This patch can now move forward. :)
Title: Re: Viewing curve speed limits and calculating acceleration time/distance
Post by: Vladki on January 04, 2021, 09:42:29 PM
Post by: Vladki on January 04, 2021, 09:42:29 PM
I see the accel graphs in new tab in convoy dialog. Looks good. Is this considered finished?
Title: Re: Viewing curve speed limits and calculating acceleration time/distance
Post by: PJMack on June 13, 2021, 07:45:37 PM
Post by: PJMack on June 13, 2021, 07:45:37 PM
To answer that question on curve speed limits, I inserted a spreadsheet below (It will need to be copied and pasted into Calc as unformatted text). To determine that max speed of a vehicle on the curve, determine the number of tiles backwards, or "steps," for curves of self corecting 45 degress as well as continuous 90, 135, and 180 degree curves. For non-tilting vehicles, simply use the minimum speed for the number of steps associated with four step values found. For example if a vehicle took 4 steps to turn from 90 degrees, and 5 steps to turn from 135 degrees, the speed limit would be 42kph. For tilting vehicles, check that the minimum radius on the chart is less than the tilting_min_radius_effect, and if it is, multiplier the non-tilting speed by 130 / 100 (the "speed with tilt" columns have such multiplication done out). The chart is configurable and with the values in row 2, which are set below as the default for rail vehicles in pack128.britain. For trucks and trams, such packset has corner force dividers of 5 and 8 respectivly.
edit: I can only post the first few rows of the sheet, however all remaining rows are the same as the bottom posted row, up to 192 steps.
Code Select
assumed_curve_radius_45_degrees,,meters_per_tile,,corner_force_divider,,tilting_min_radius_effect,,,,,,,,,
750,,125,,10,,375,,,,,,,,,
,,,,,,,,,,,,,,,
Steps:,Radius,,,,Speed,,,,Speed with tilt,,,,,,
,45?-45?,90?,135?,180?,45?-45?,90?,135?,180?,45?-45?,90?,135?,180?,,Vehicle Top Speed (kph),Max Steps
1,"=MAX($A$2,$A6 * $C$2)",=FLOOR($A6 * $C$2 / 2),=FLOOR($A6 * $C$2 / 3),"=FLOOR(MAX(1,FLOOR($A6 / 2)) * $C$2 / 2)",=FLOOR(SQRT(FLOOR(87 * B6 / $E$2))),,,,"=IF(B6<$G$2,'',FLOOR(F6*1.3))",,,,,5,=FLOOR(FLOOR(O6*O6 * $E$2 / 87) / $C$2) * 2
=A6+1,"=MAX($A$2,$A7 * $C$2)",=FLOOR($A7 * $C$2 / 2),=FLOOR($A7 * $C$2 / 3),"=FLOOR(MAX(1,FLOOR($A7 / 2)) * $C$2 / 2)",=FLOOR(SQRT(FLOOR(87 * B7 / $E$2))),=FLOOR(SQRT(FLOOR(87 * C7 / $E$2))),,,"=IF(B7<$G$2,"""",FLOOR(F7*1.3))","=IF(C7<$G$2,"""",FLOOR(G7*1.3))",,,,=O6+5,=FLOOR(FLOOR(O7*O7 * $E$2 / 87) / $C$2) * 2
=A7+1,"=MAX($A$2,$A8 * $C$2)",=FLOOR($A8 * $C$2 / 2),=FLOOR($A8 * $C$2 / 3),"=FLOOR(MAX(1,FLOOR($A8 / 2)) * $C$2 / 2)",=FLOOR(SQRT(FLOOR(87 * B8 / $E$2))),=FLOOR(SQRT(FLOOR(87 * C8 / $E$2))),=FLOOR(SQRT(FLOOR(87 * D8 / $E$2))),=FLOOR(SQRT(FLOOR(87 * E8 / $E$2))),"=IF(B8<$G$2,"""",FLOOR(F8*1.3))","=IF(C8<$G$2,"""",FLOOR(G8*1.3))","=IF(D8<$G$2,"""",FLOOR(H8*1.3))","=IF(E8<$G$2,"""",FLOOR(I8*1.3))",,=O7+5,=FLOOR(FLOOR(O8*O8 * $E$2 / 87) / $C$2) * 2
=A8+1,"=MAX($A$2,$A9 * $C$2)",=FLOOR($A9 * $C$2 / 2),=FLOOR($A9 * $C$2 / 3),"=FLOOR(MAX(1,FLOOR($A9 / 2)) * $C$2 / 2)",=FLOOR(SQRT(FLOOR(87 * B9 / $E$2))),=FLOOR(SQRT(FLOOR(87 * C9 / $E$2))),=FLOOR(SQRT(FLOOR(87 * D9 / $E$2))),=FLOOR(SQRT(FLOOR(87 * E9 / $E$2))),"=IF(B9<$G$2,"""",FLOOR(F9*1.3))","=IF(C9<$G$2,"""",FLOOR(G9*1.3))","=IF(D9<$G$2,"""",FLOOR(H9*1.3))","=IF(E9<$G$2,"""",FLOOR(I9*1.3))",,=O8+5,=FLOOR(FLOOR(O9*O9 * $E$2 / 87) / $C$2) * 2
=A9+1,"=MAX($A$2,$A10 * $C$2)",=FLOOR($A10 * $C$2 / 2),=FLOOR($A10 * $C$2 / 3),"=FLOOR(MAX(1,FLOOR($A10 / 2)) * $C$2 / 2)",=FLOOR(SQRT(FLOOR(87 * B10 / $E$2))),=FLOOR(SQRT(FLOOR(87 * C10 / $E$2))),=FLOOR(SQRT(FLOOR(87 * D10 / $E$2))),=FLOOR(SQRT(FLOOR(87 * E10 / $E$2))),"=IF(B10<$G$2,"""",FLOOR(F10*1.3))","=IF(C10<$G$2,"""",FLOOR(G10*1.3))","=IF(D10<$G$2,"""",FLOOR(H10*1.3))","=IF(E10<$G$2,"""",FLOOR(I10*1.3))",,=O9+5,=FLOOR(FLOOR(O10*O10 * $E$2 / 87) / $C$2) * 2
=A10+1,"=MAX($A$2,$A11 * $C$2)",=FLOOR($A11 * $C$2 / 2),=FLOOR($A11 * $C$2 / 3),"=FLOOR(MAX(1,FLOOR($A11 / 2)) * $C$2 / 2)",=FLOOR(SQRT(FLOOR(87 * B11 / $E$2))),=FLOOR(SQRT(FLOOR(87 * C11 / $E$2))),=FLOOR(SQRT(FLOOR(87 * D11 / $E$2))),=FLOOR(SQRT(FLOOR(87 * E11 / $E$2))),"=IF(B11<$G$2,"""",FLOOR(F11*1.3))","=IF(C11<$G$2,"""",FLOOR(G11*1.3))","=IF(D11<$G$2,"""",FLOOR(H11*1.3))","=IF(E11<$G$2,"""",FLOOR(I11*1.3))",,=O10+5,=FLOOR(FLOOR(O11*O11 * $E$2 / 87) / $C$2) * 2
edit: I can only post the first few rows of the sheet, however all remaining rows are the same as the bottom posted row, up to 192 steps.
Title: Re: Viewing curve speed limits and calculating acceleration time/distance
Post by: Ranran(retired) on June 26, 2021, 11:39:53 PM
Post by: Ranran(retired) on June 26, 2021, 11:39:53 PM
As suggested somewhere before, I think we can divide the car body tilt angle into multiple levels (or the angle itself).